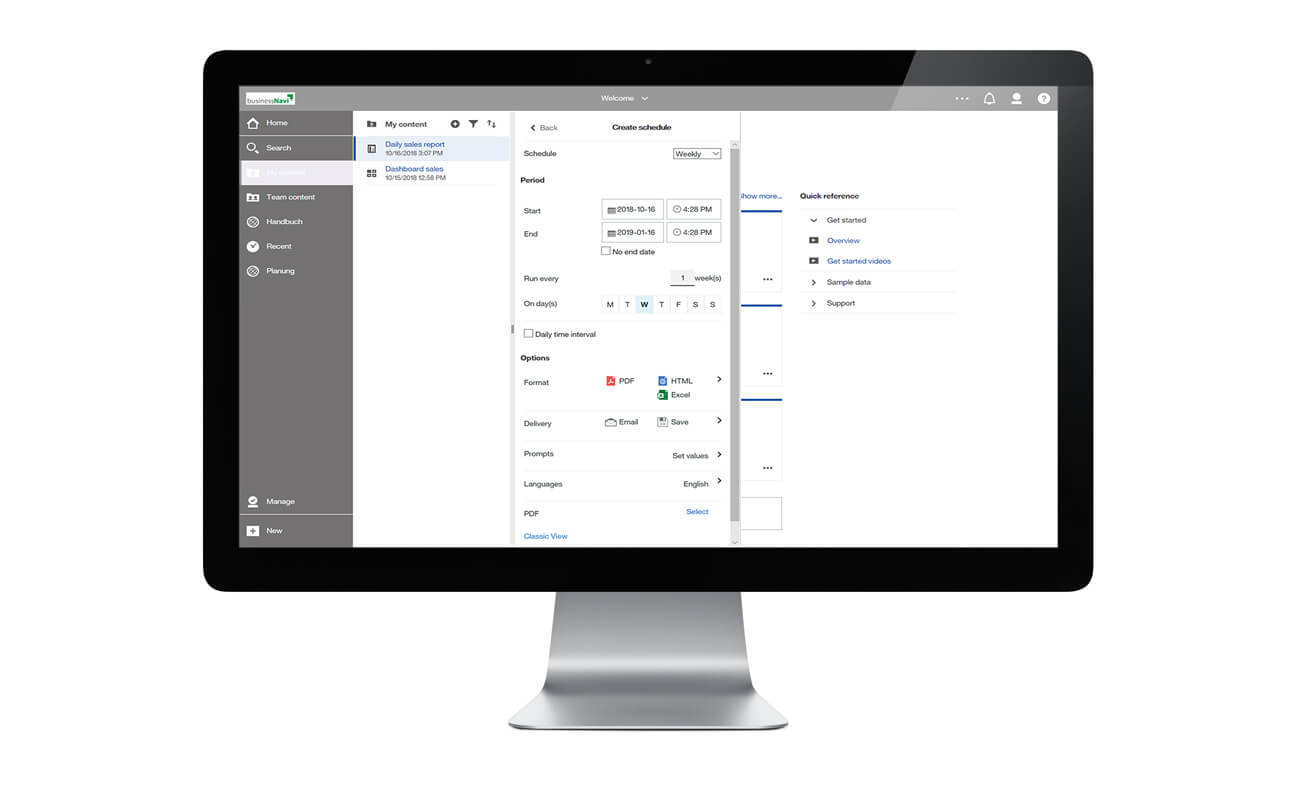
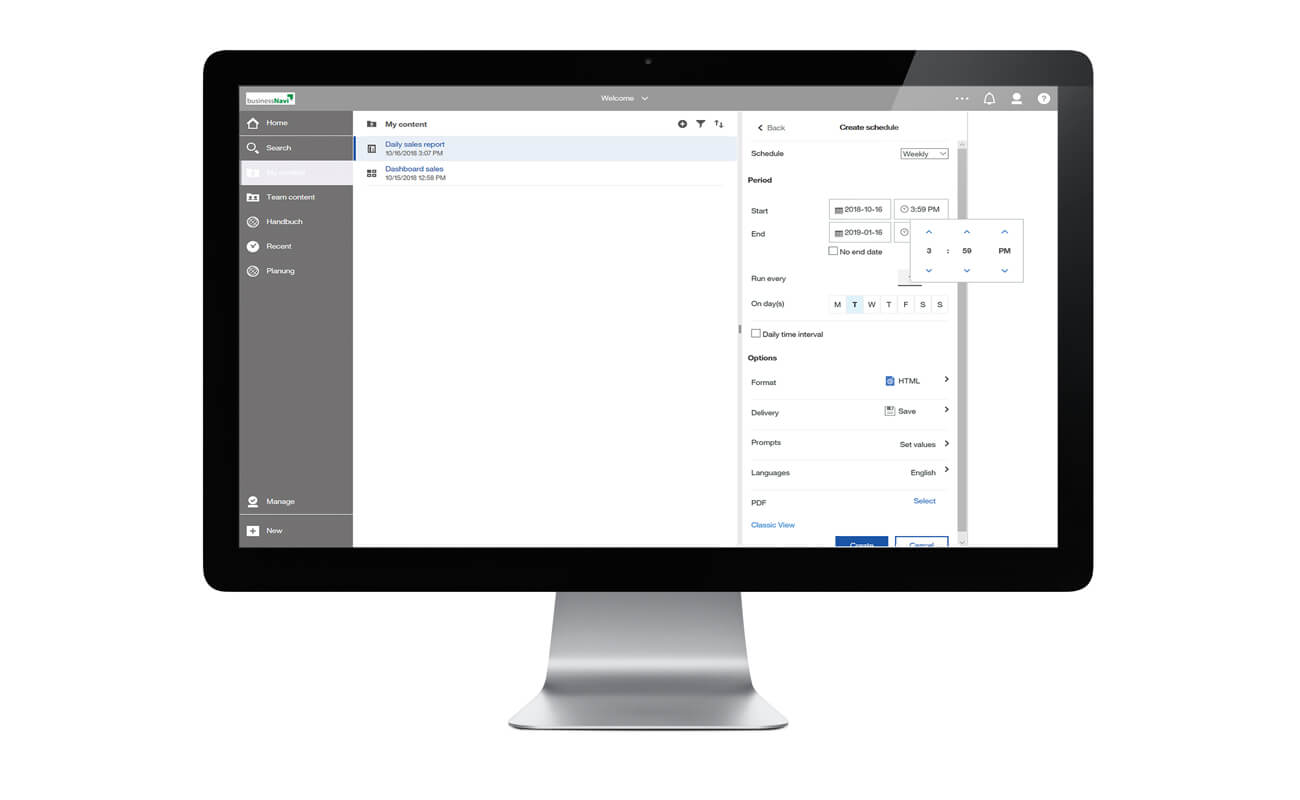
Simply be informed …
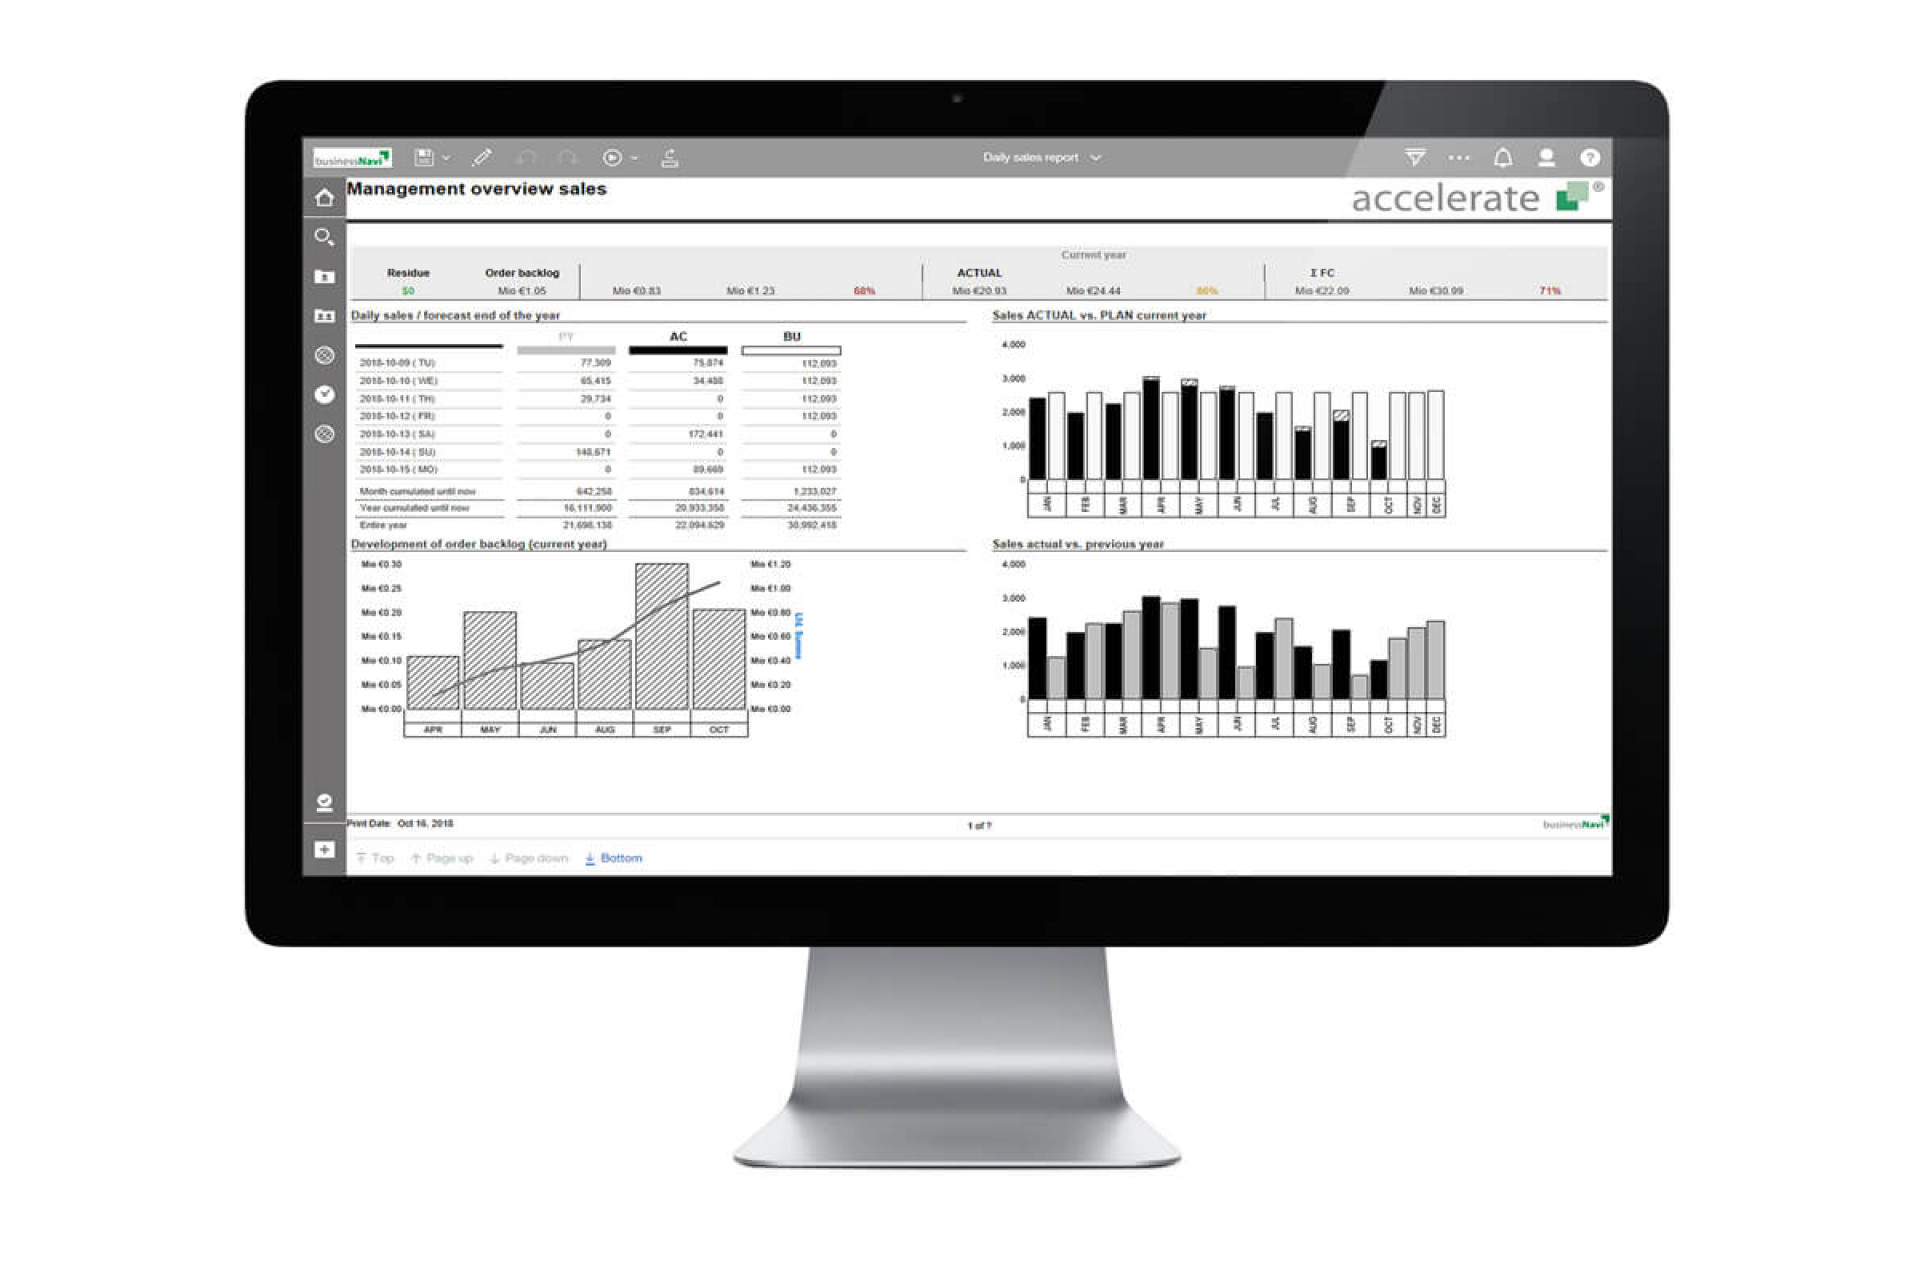
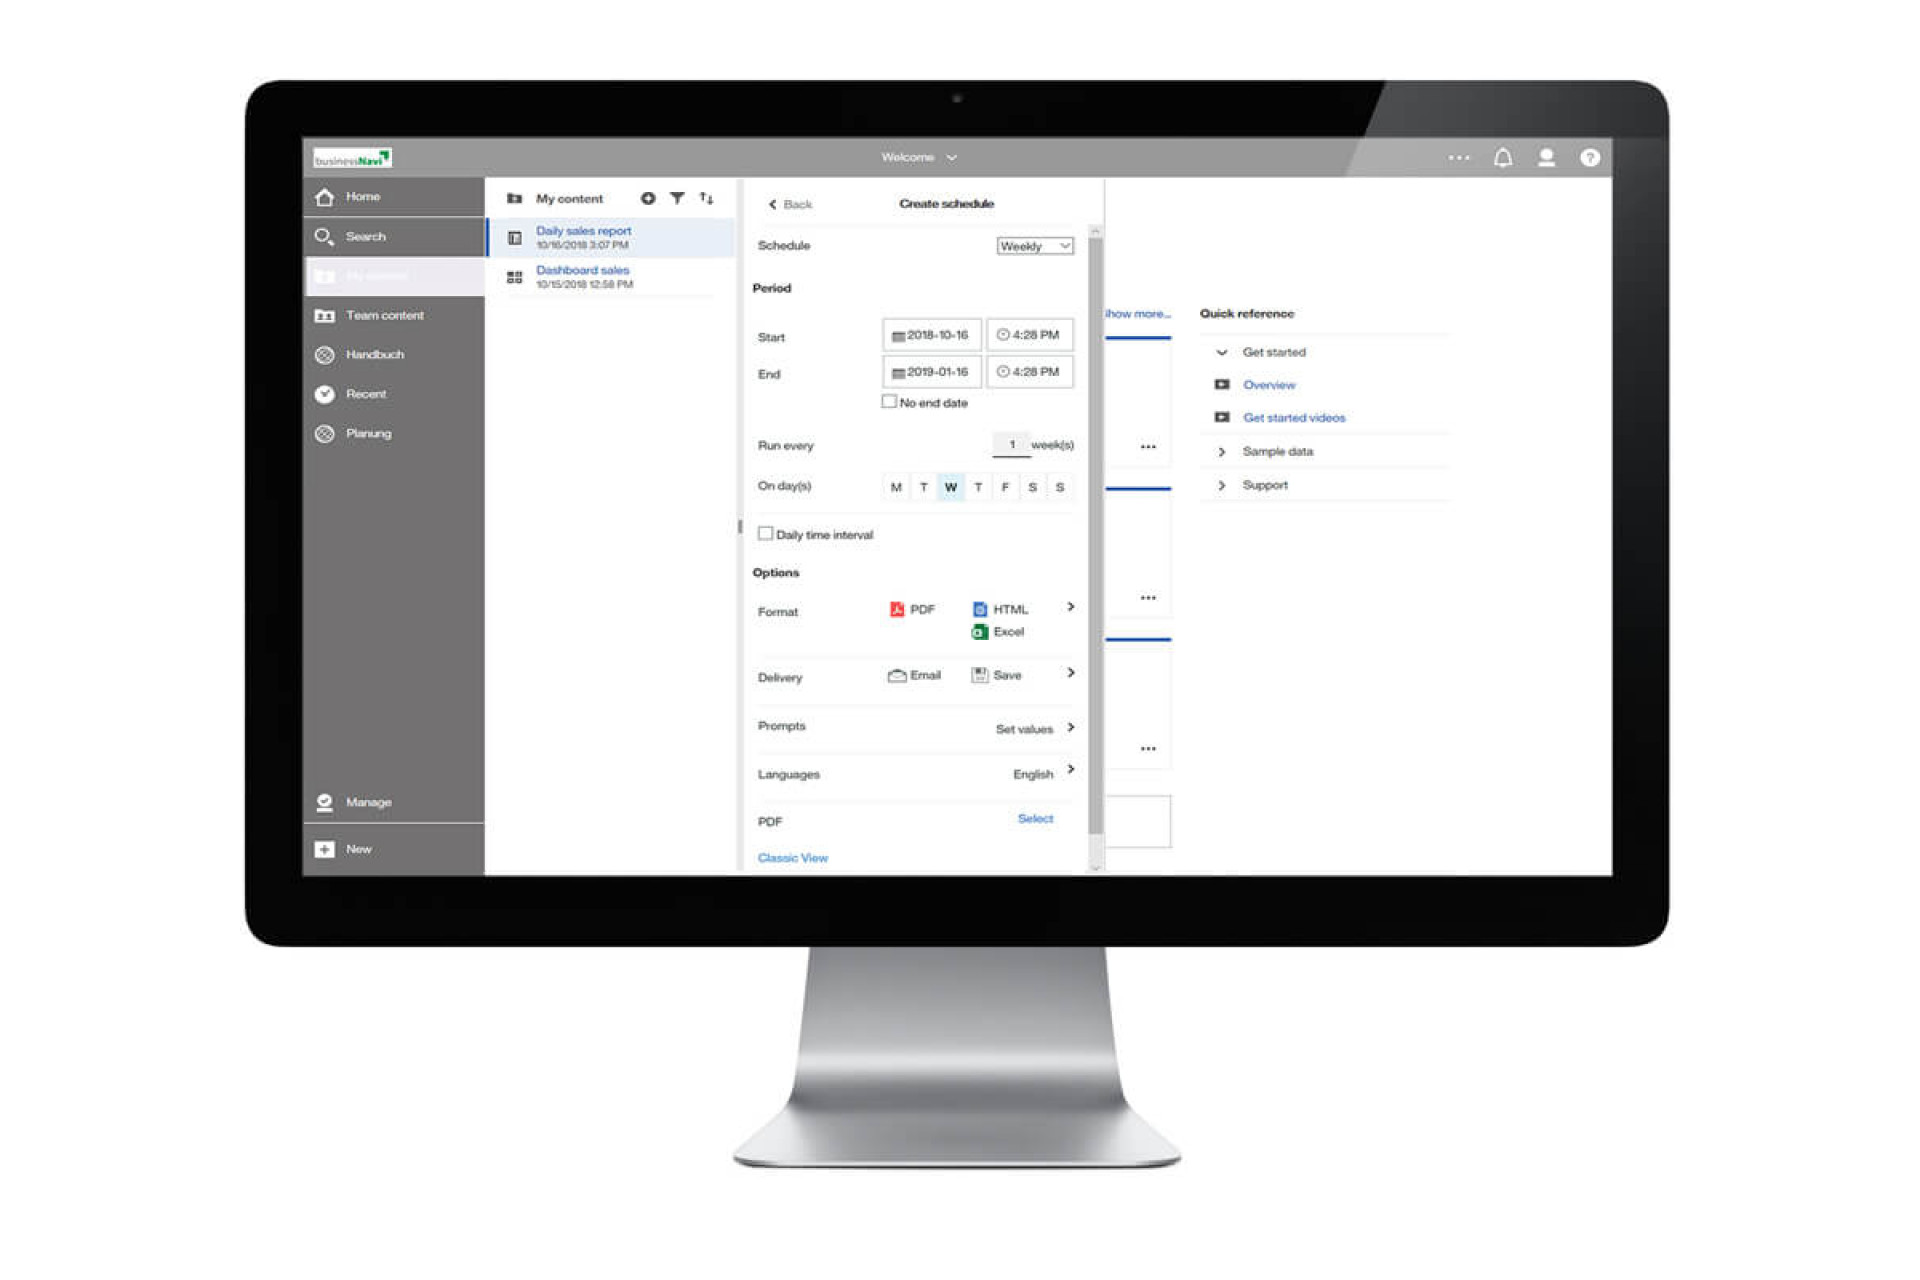
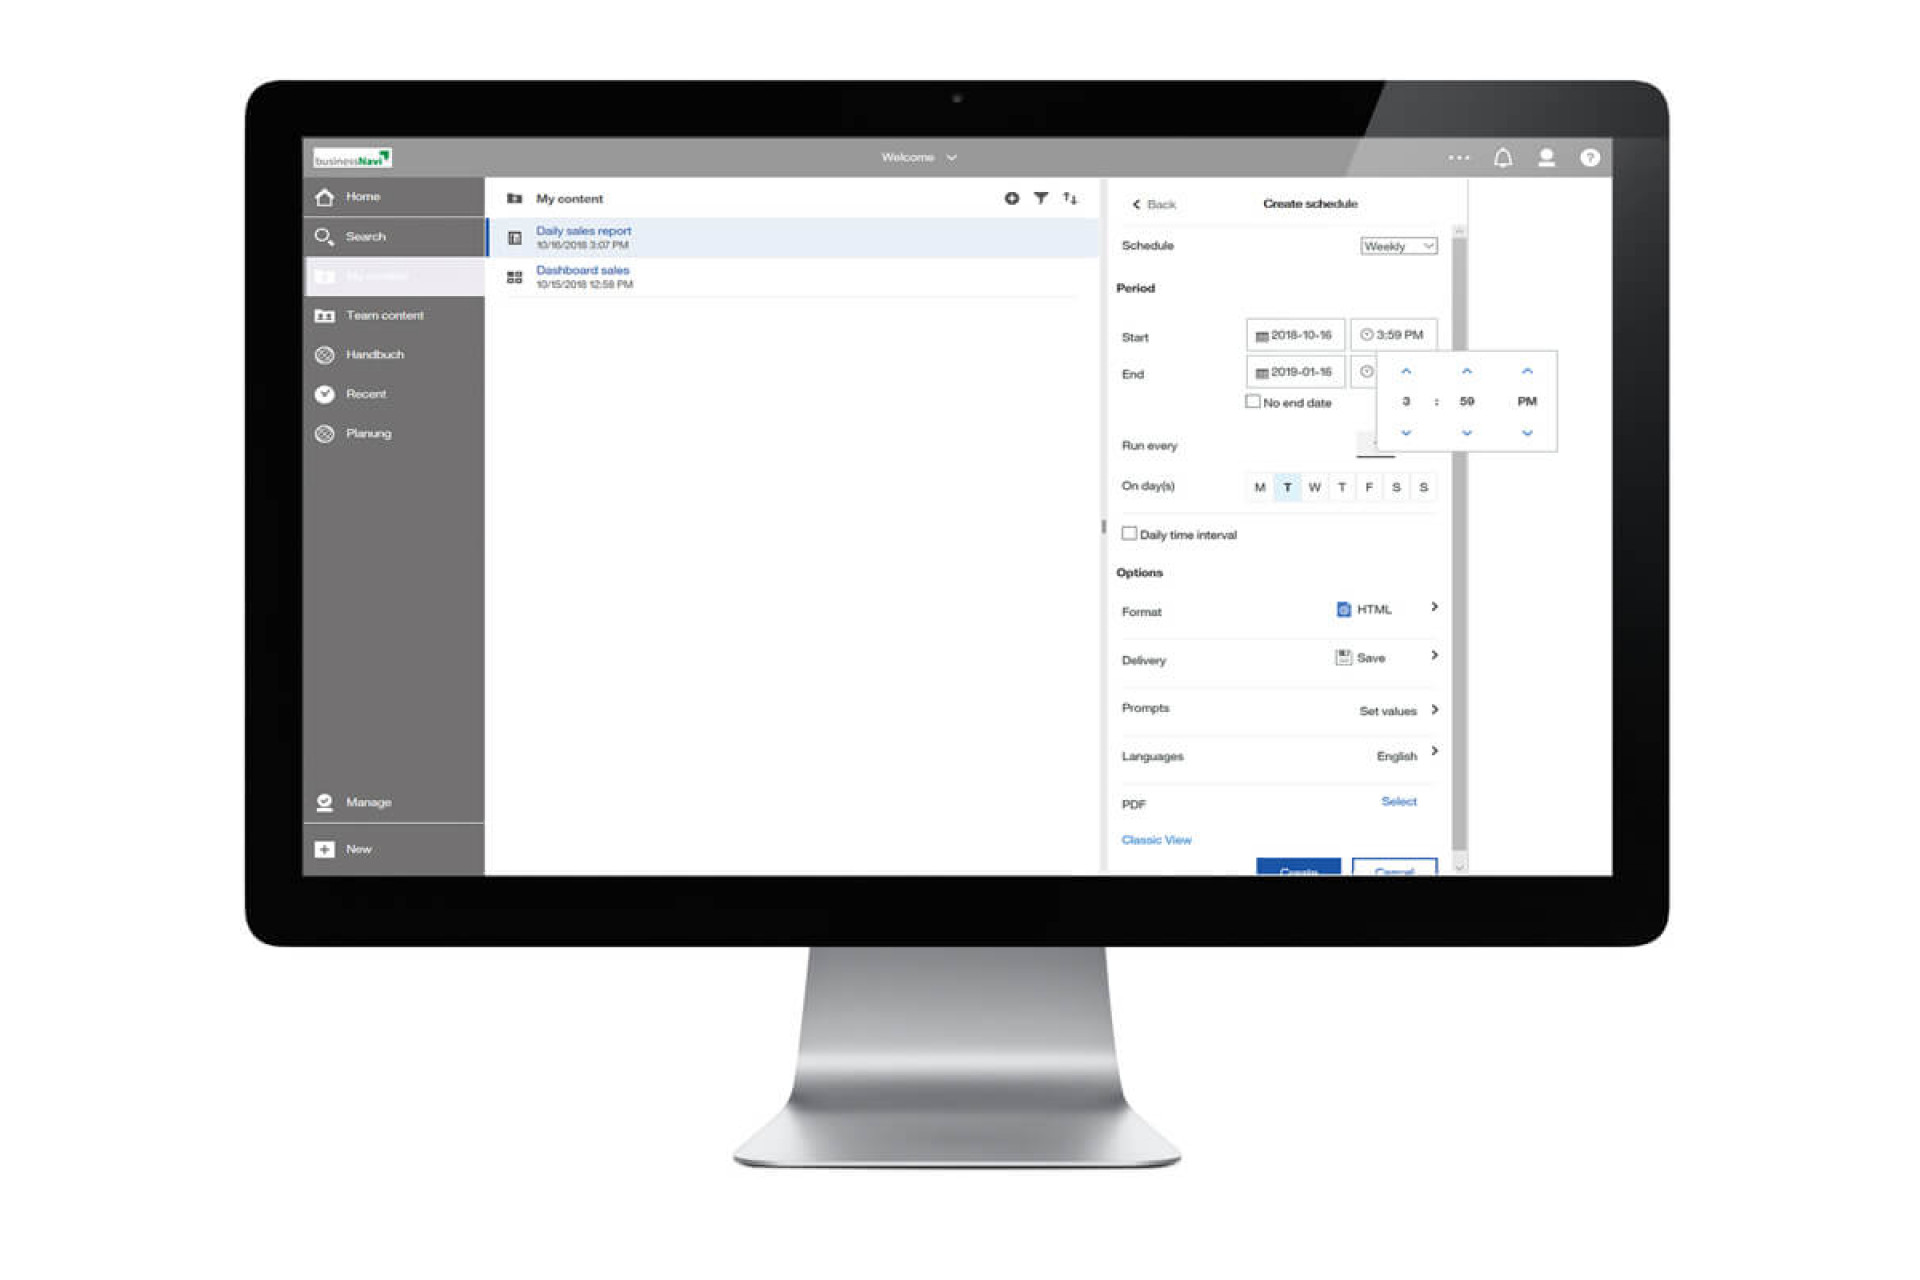
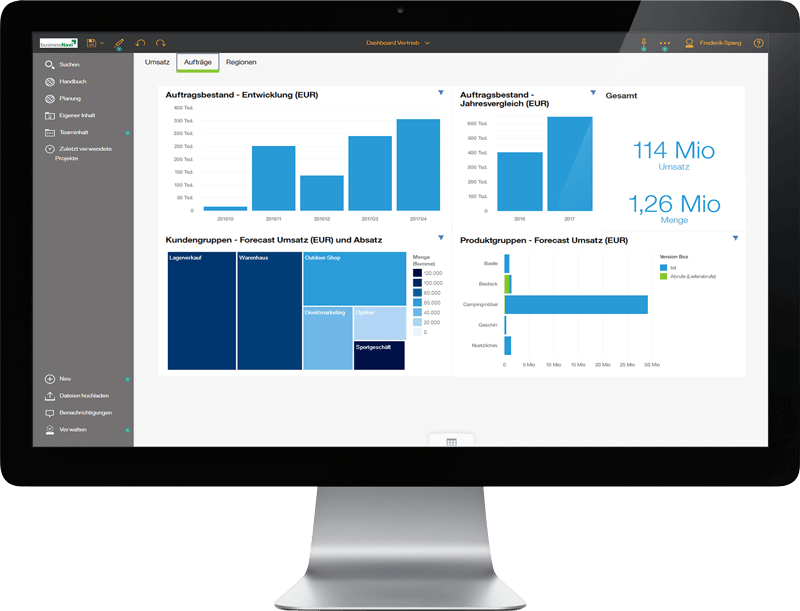
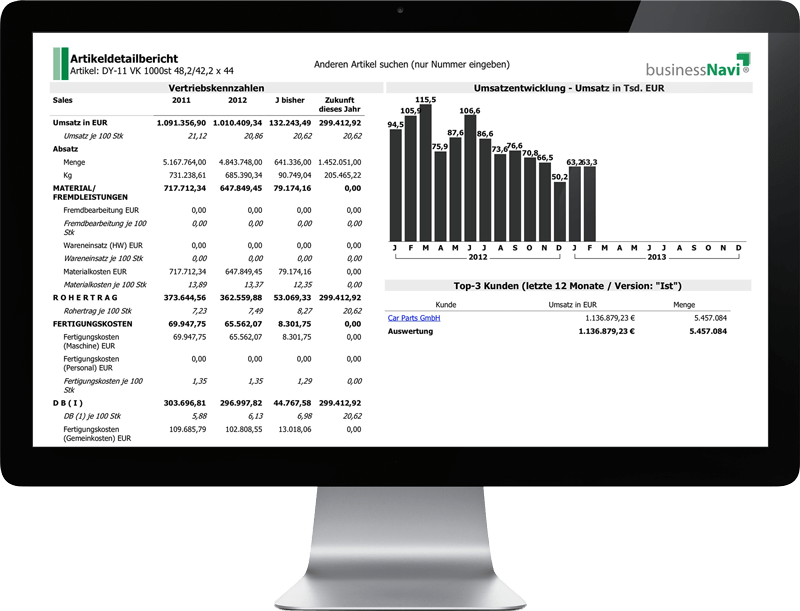
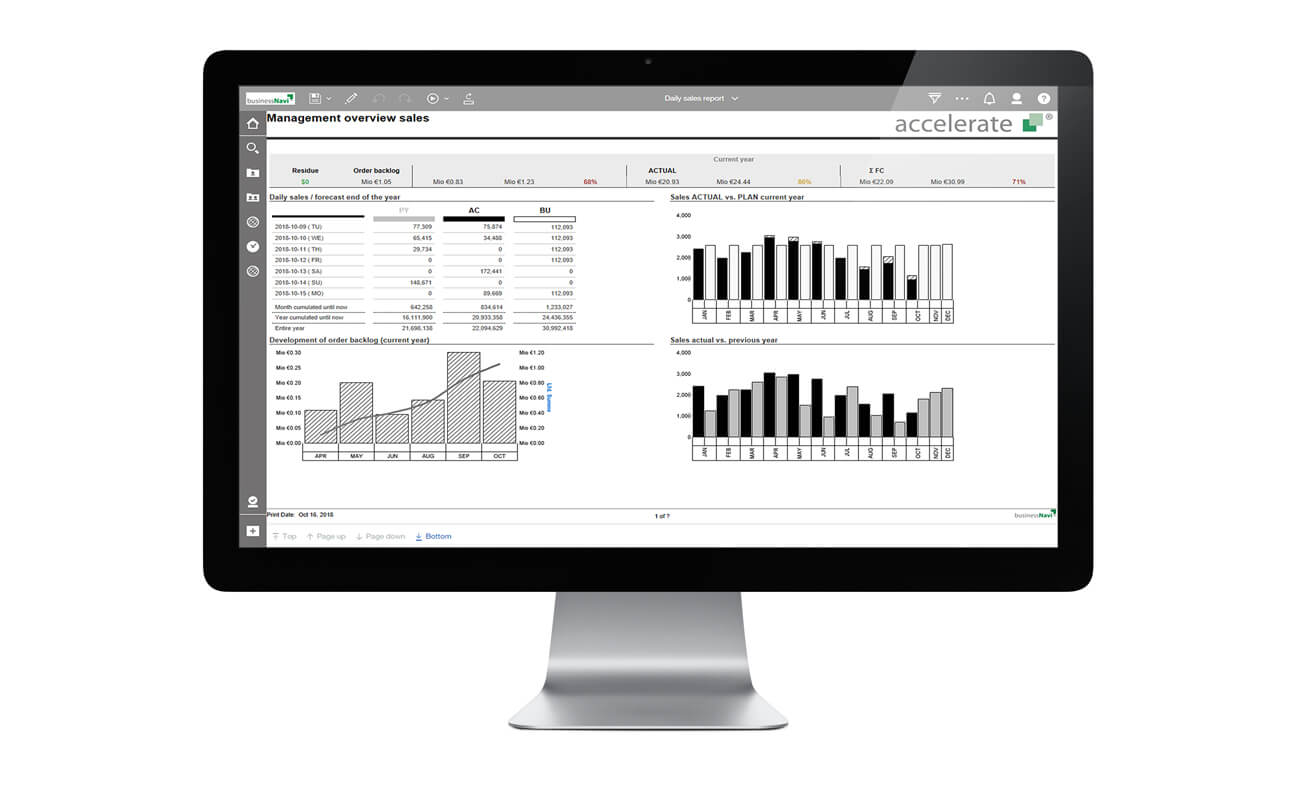
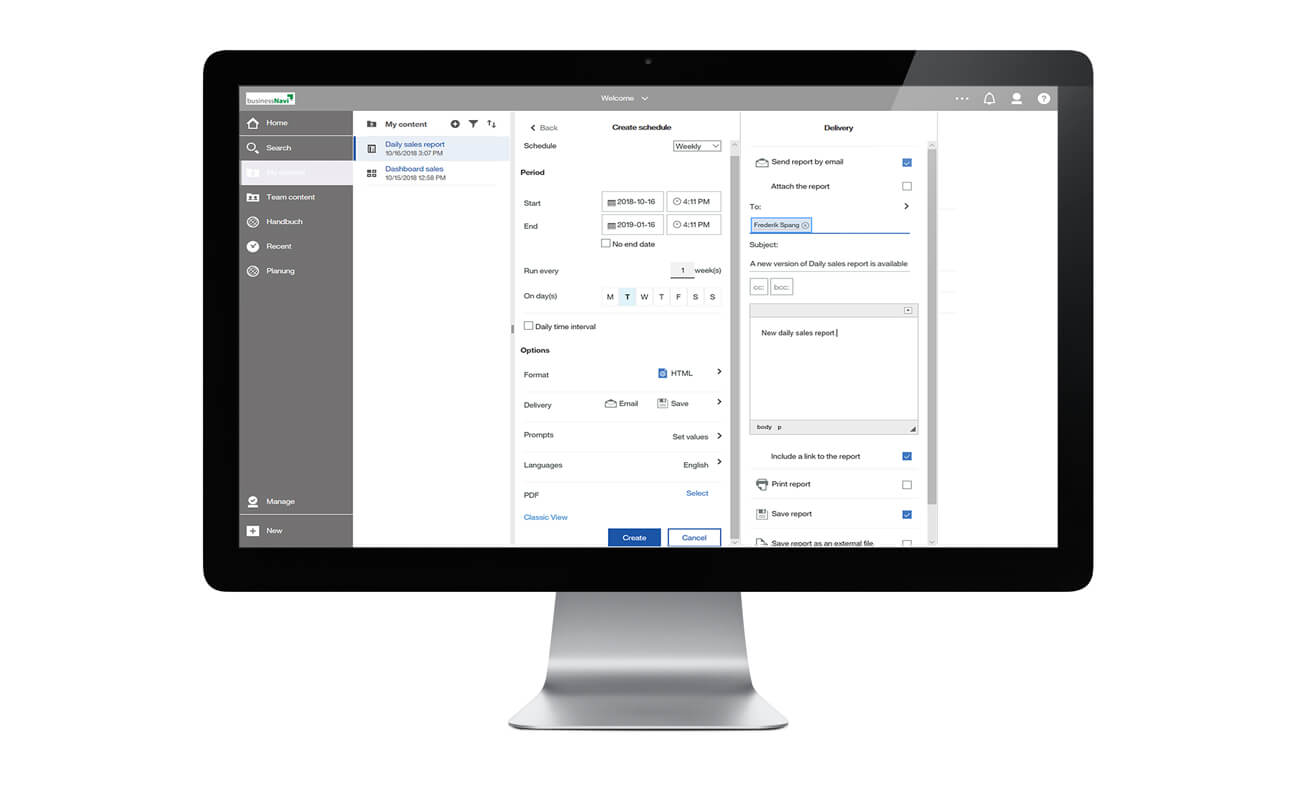
Subscribe to reports with relevant information. This can be an aggregated daily report with key performance indicators on sales, order backlog, deviations from planned figuers or contribution margins as well as detailed reports with KPIs on individual orders, customers or products.
You decide which information you need on a daily basis. The preparation of the necessary data, including quality assurance, is managed by businessNavi. You focus exclusively on the interpretation and derivation of measures.
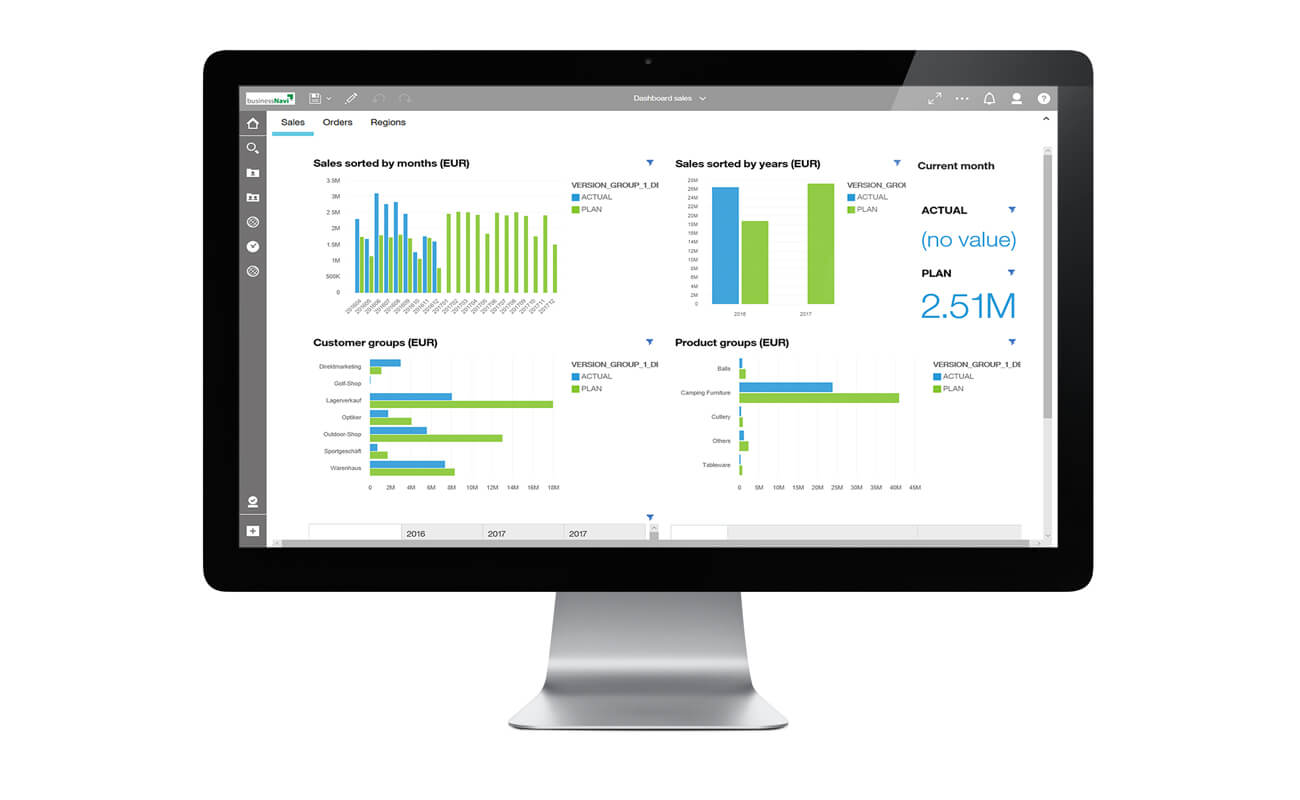
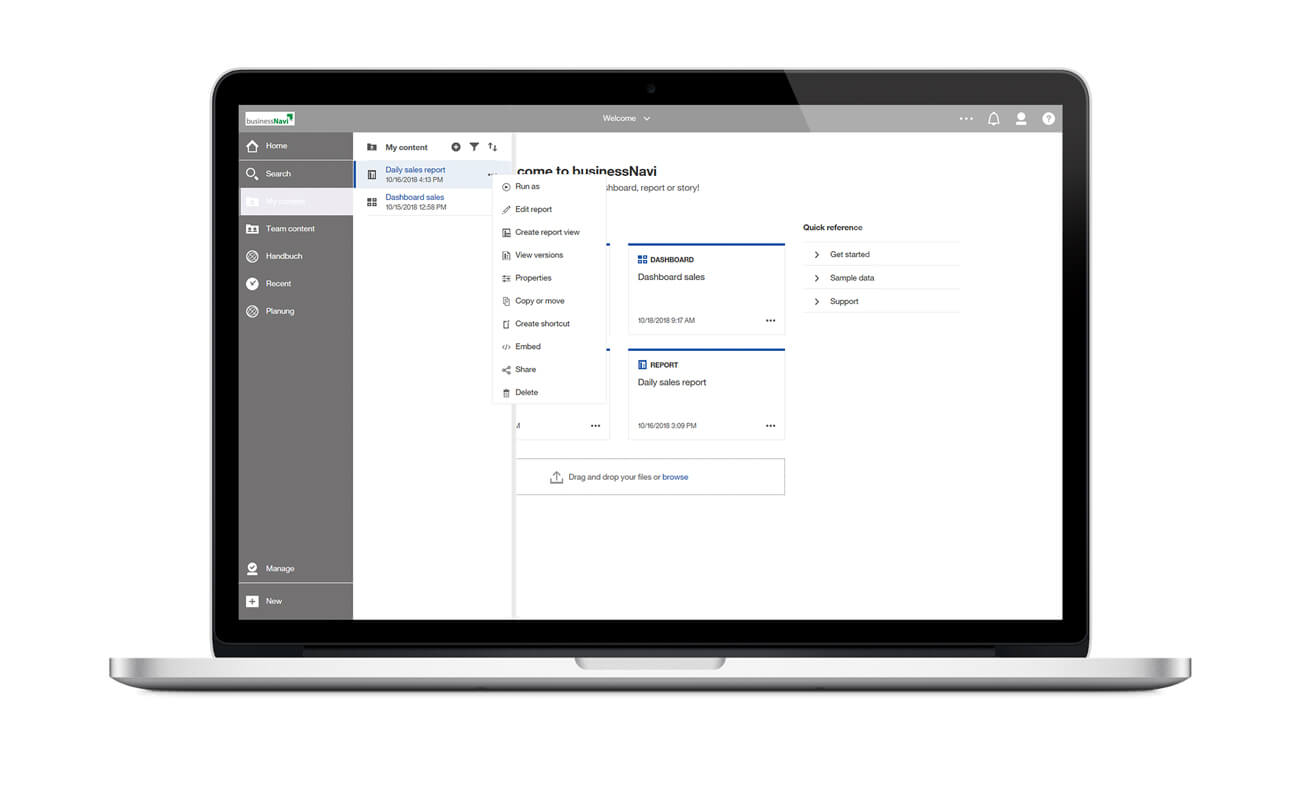
The daily report includes (here using the example of sales) relevant views of your company and displays them in an integrated way. Focus on day, current month, current year, sales, order backlog and profit margin – daily updated. Various views create a complete picture.
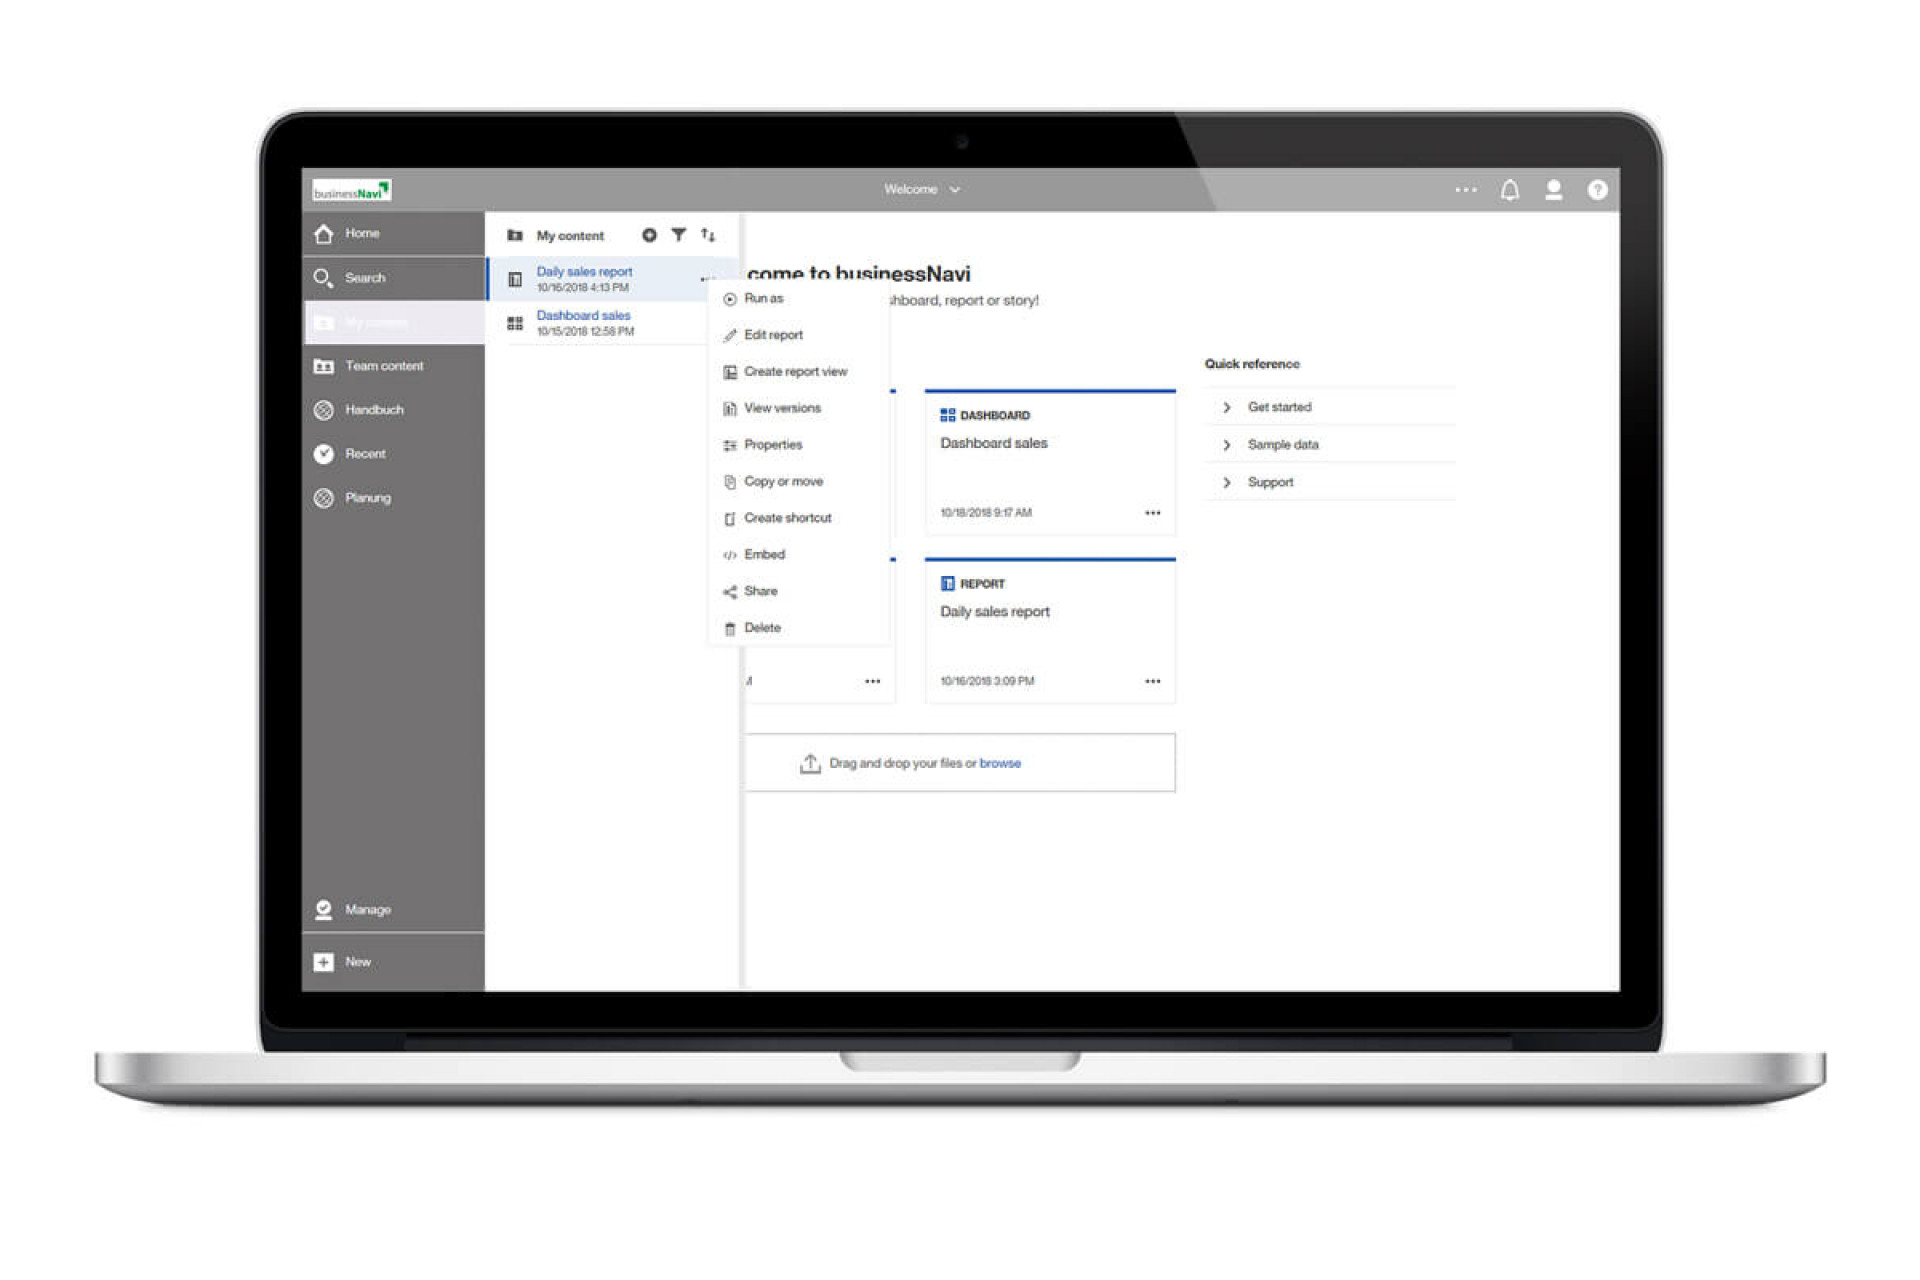
The daily report is just one of many predefined reports that you can use immediately.
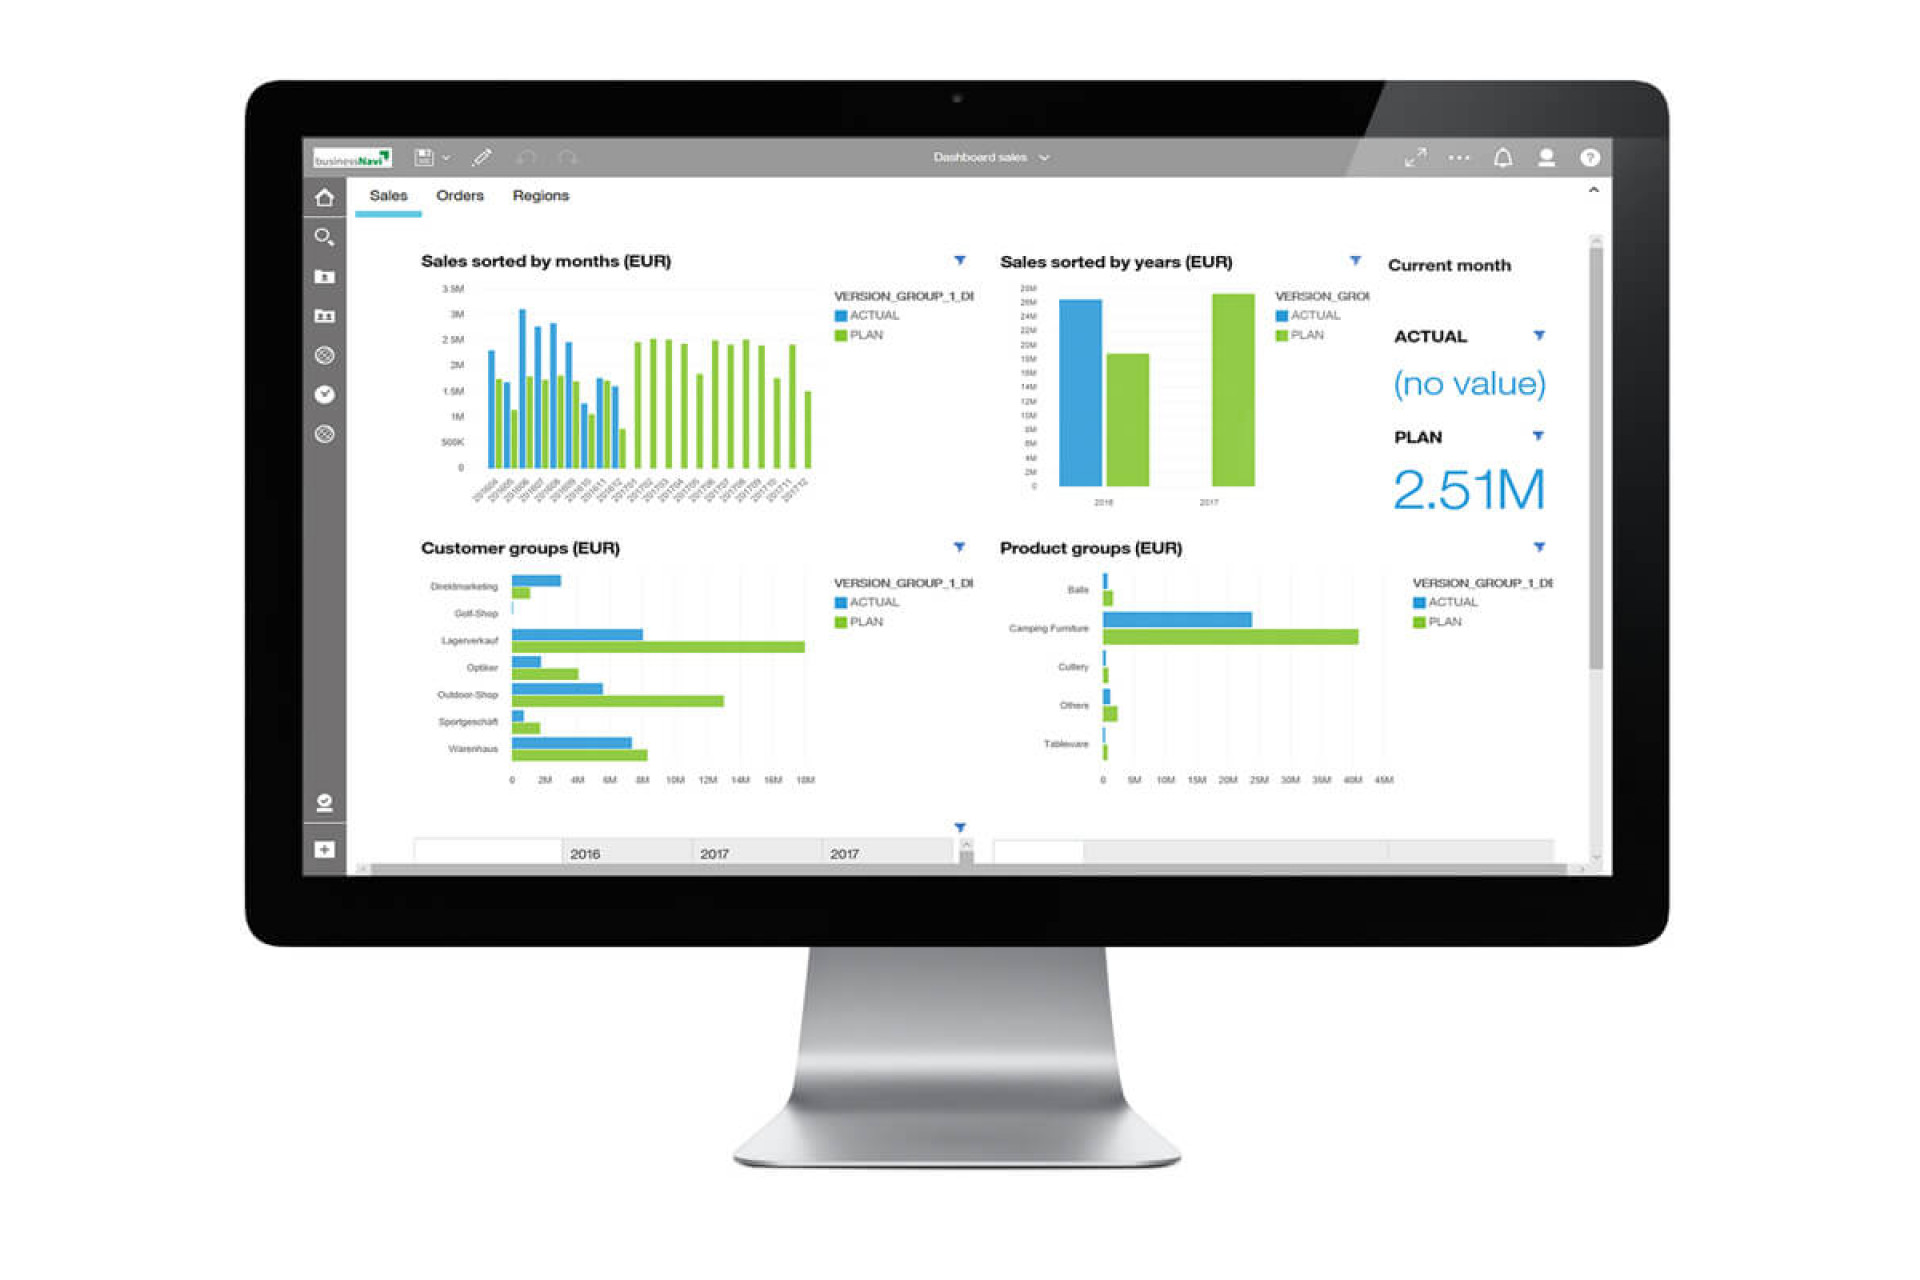
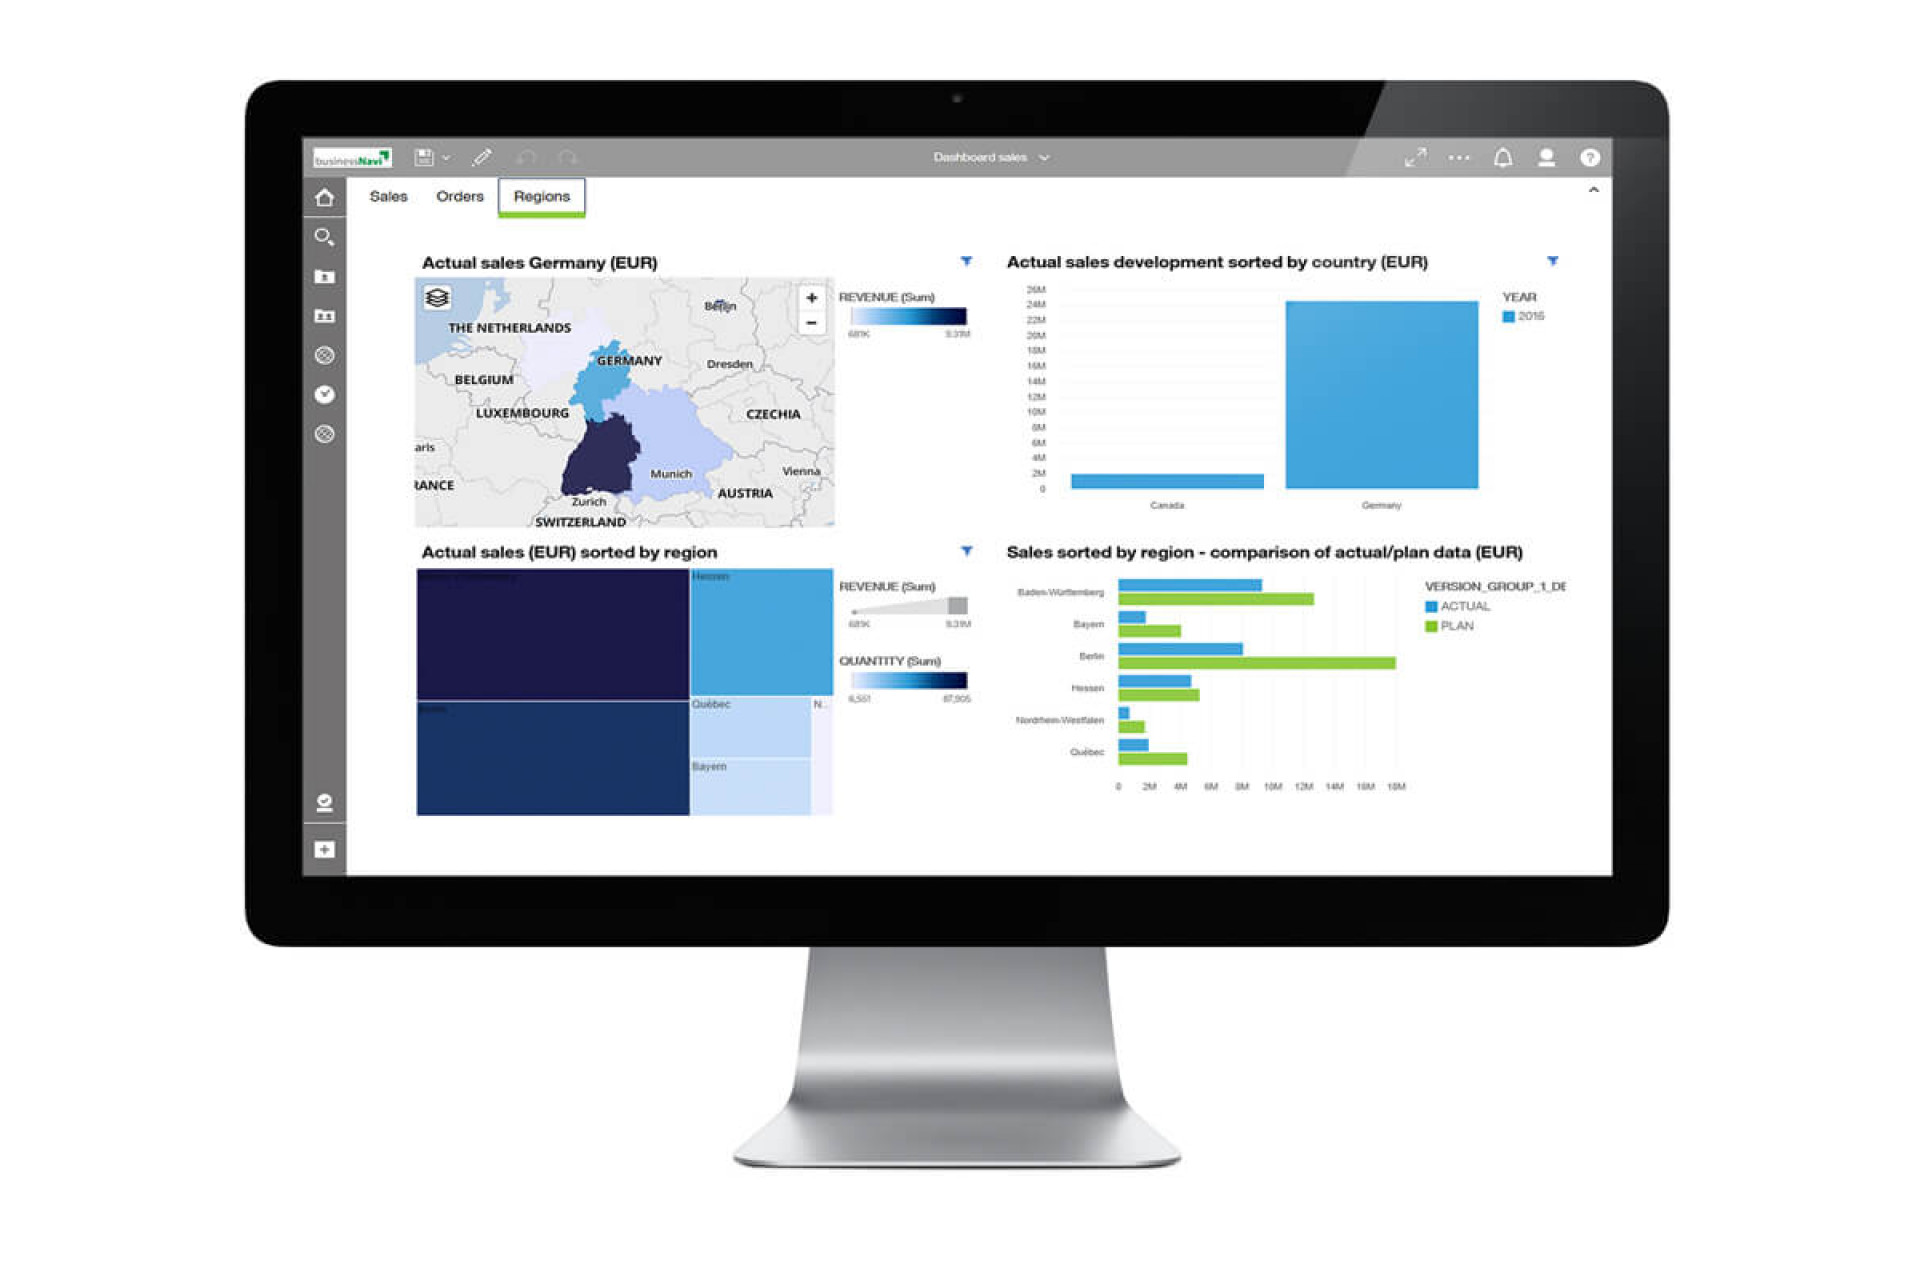
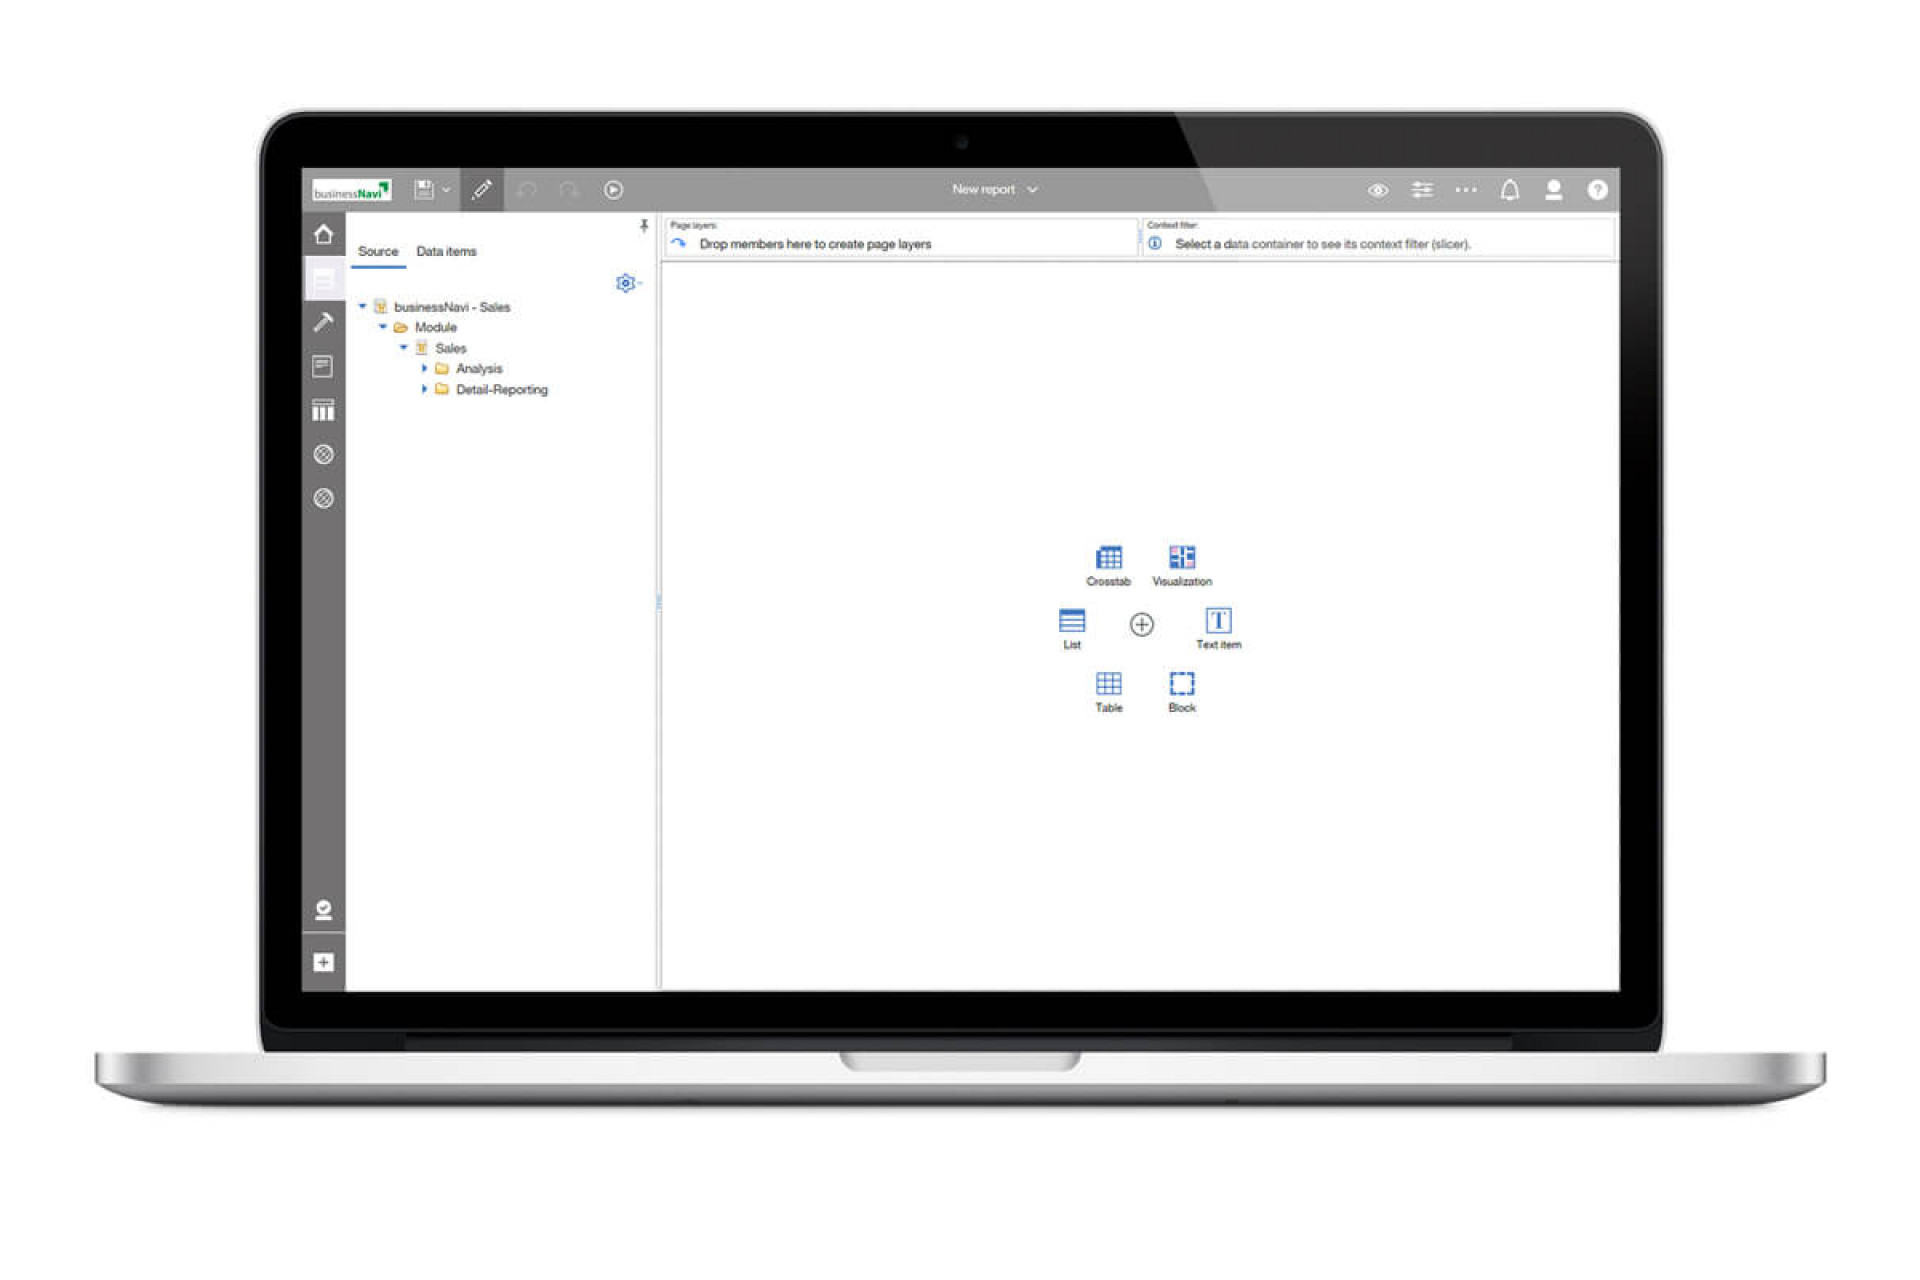
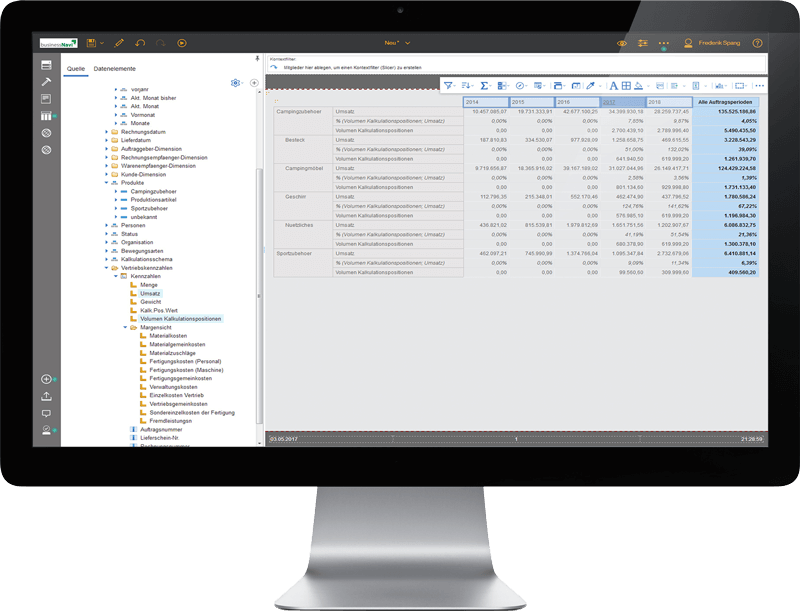
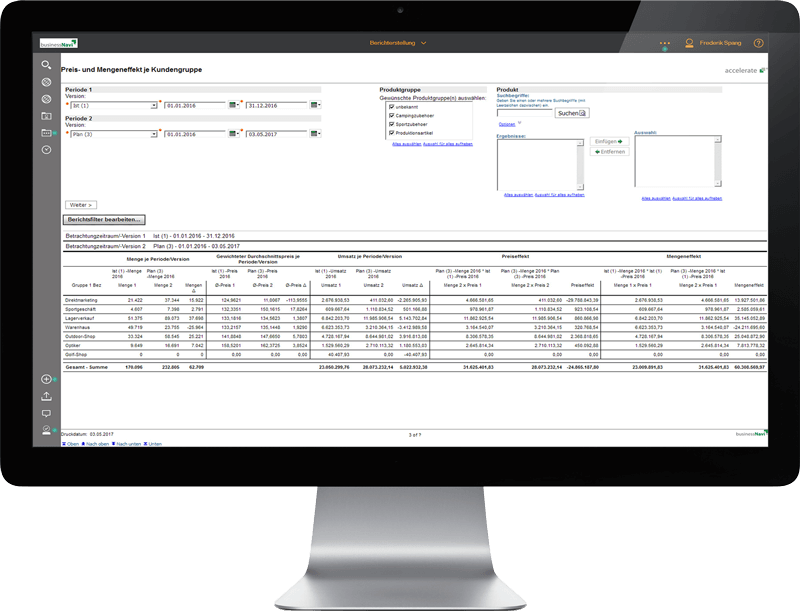
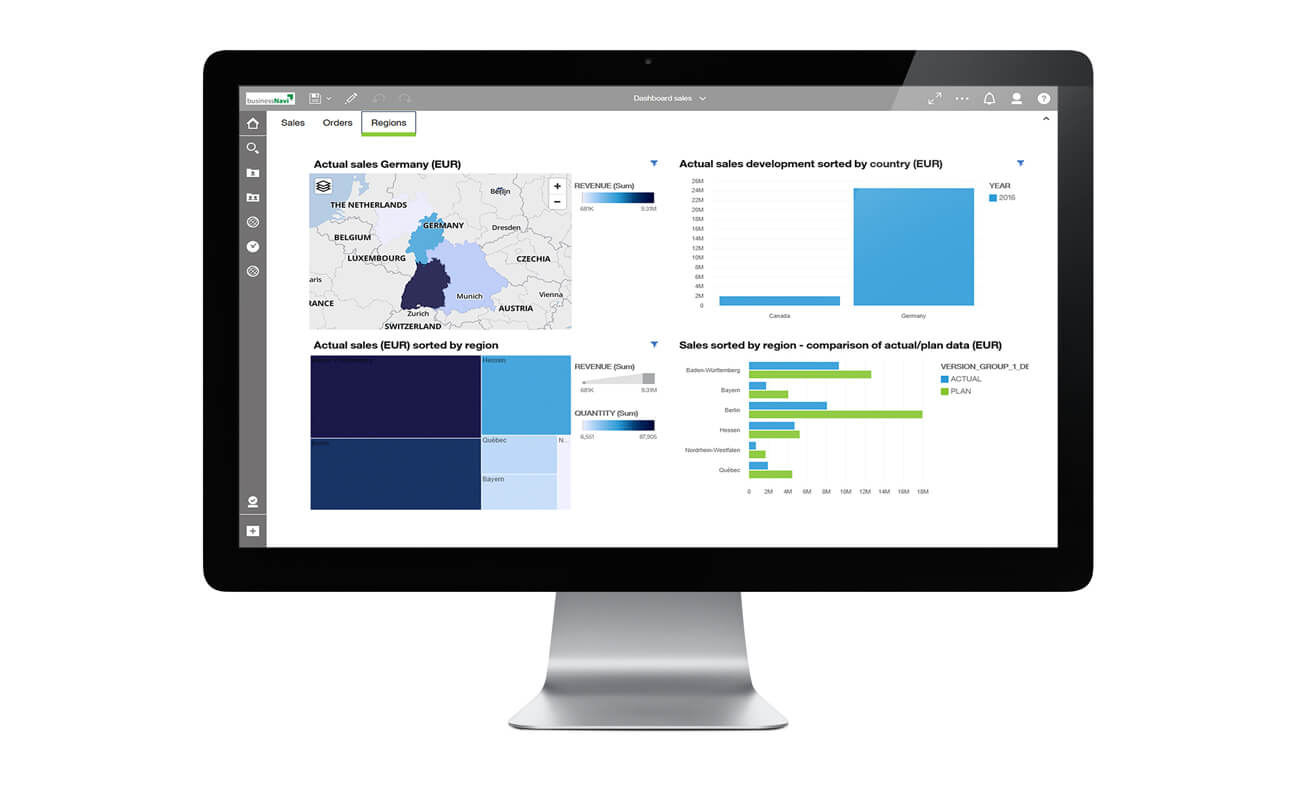
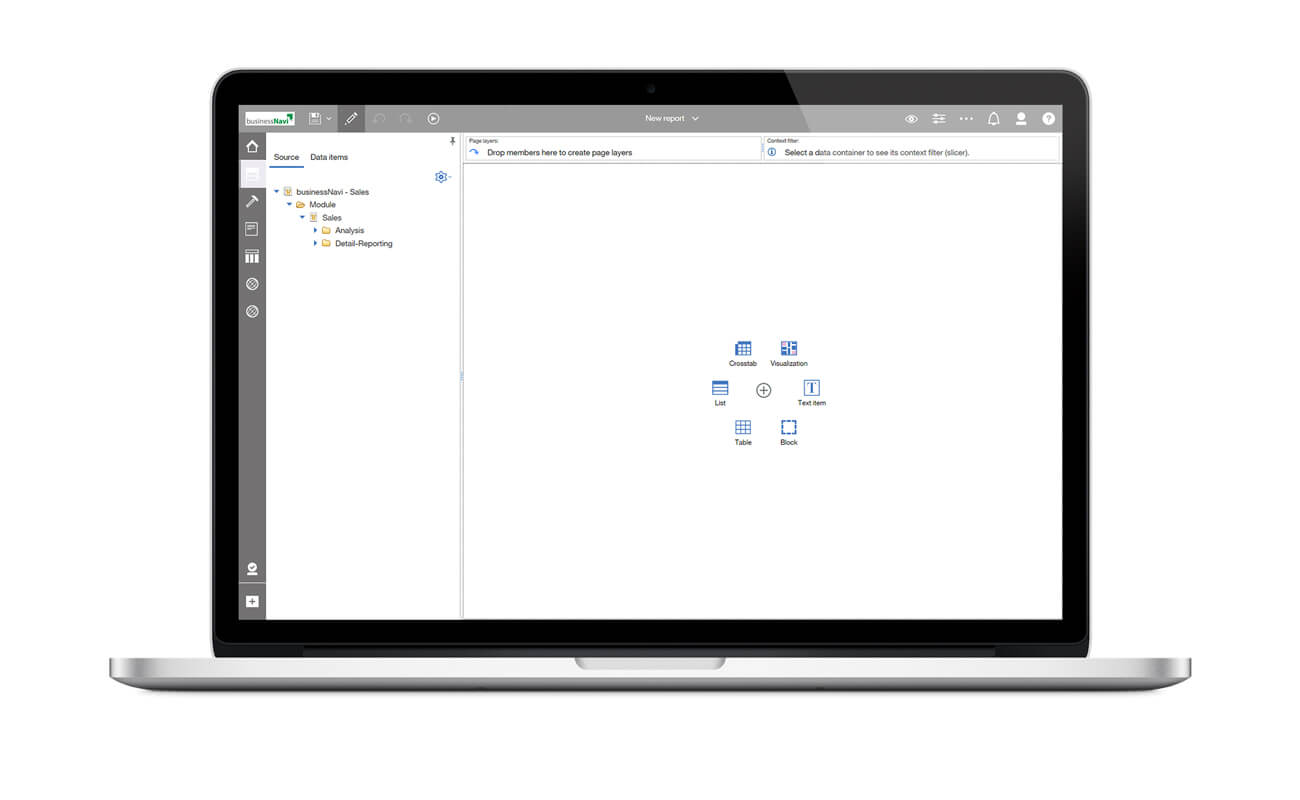
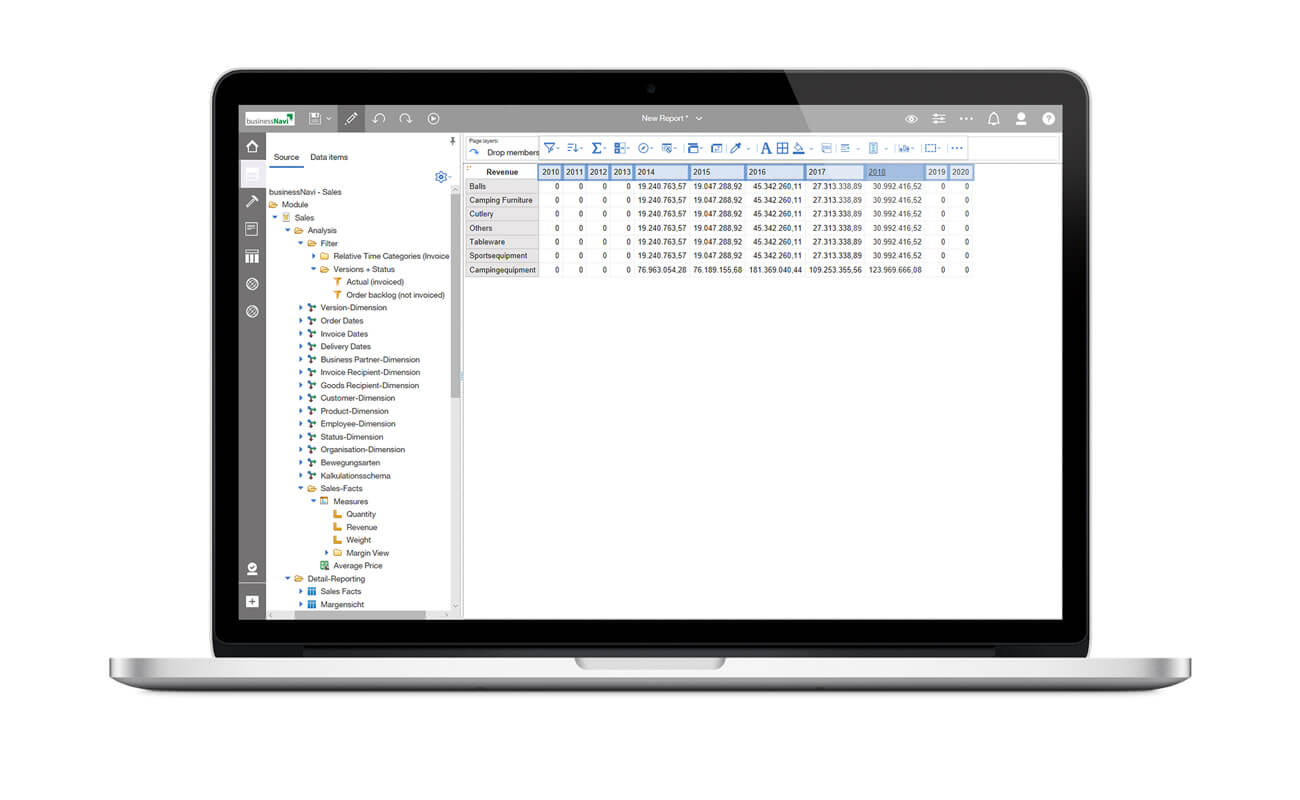
Simply analyse …
Ask questions and solve them yourself.
Each module of the businessNavi comprises a data pool that can be used independently. This can be analyzed as desired.
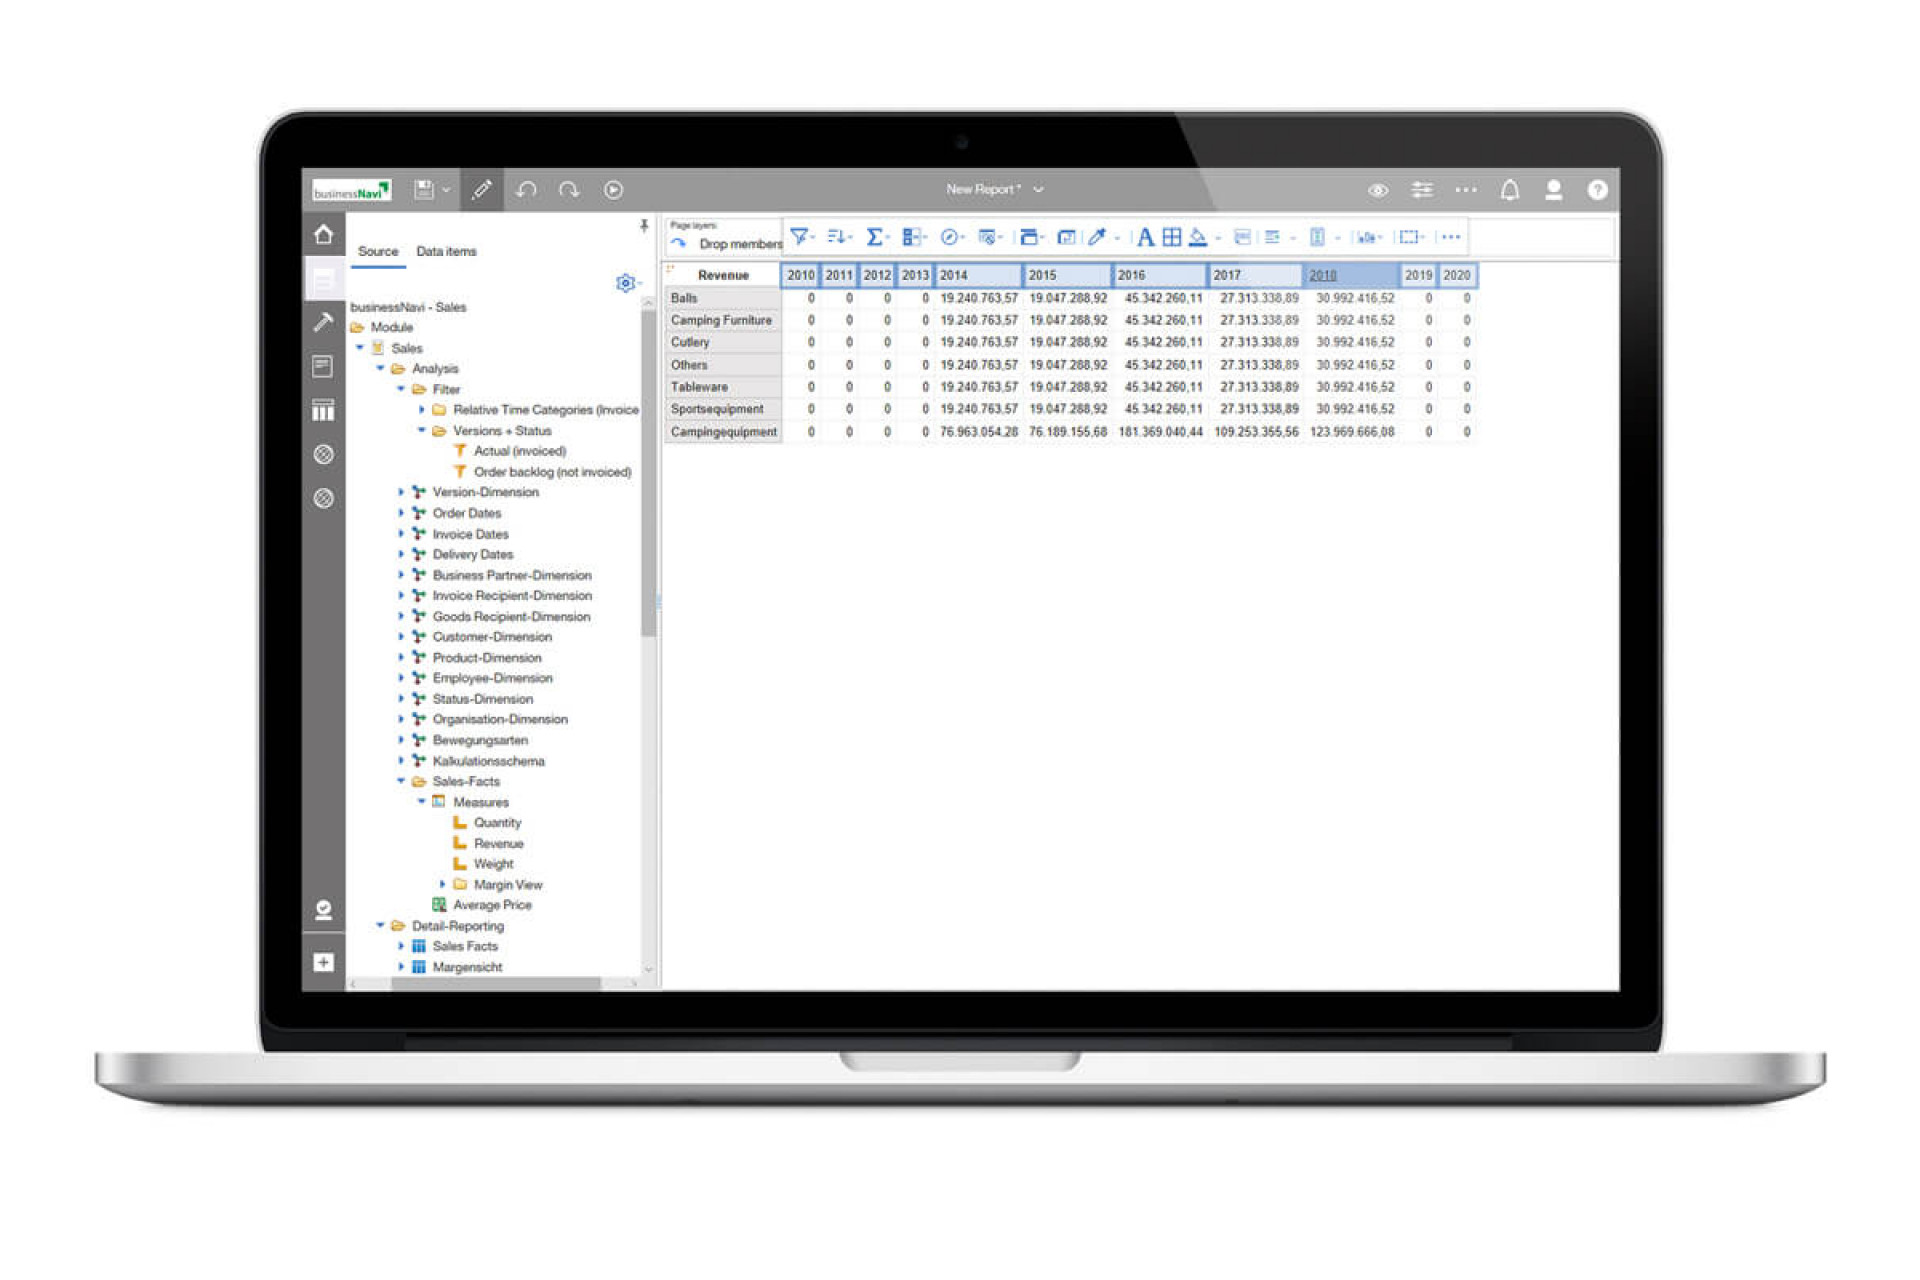
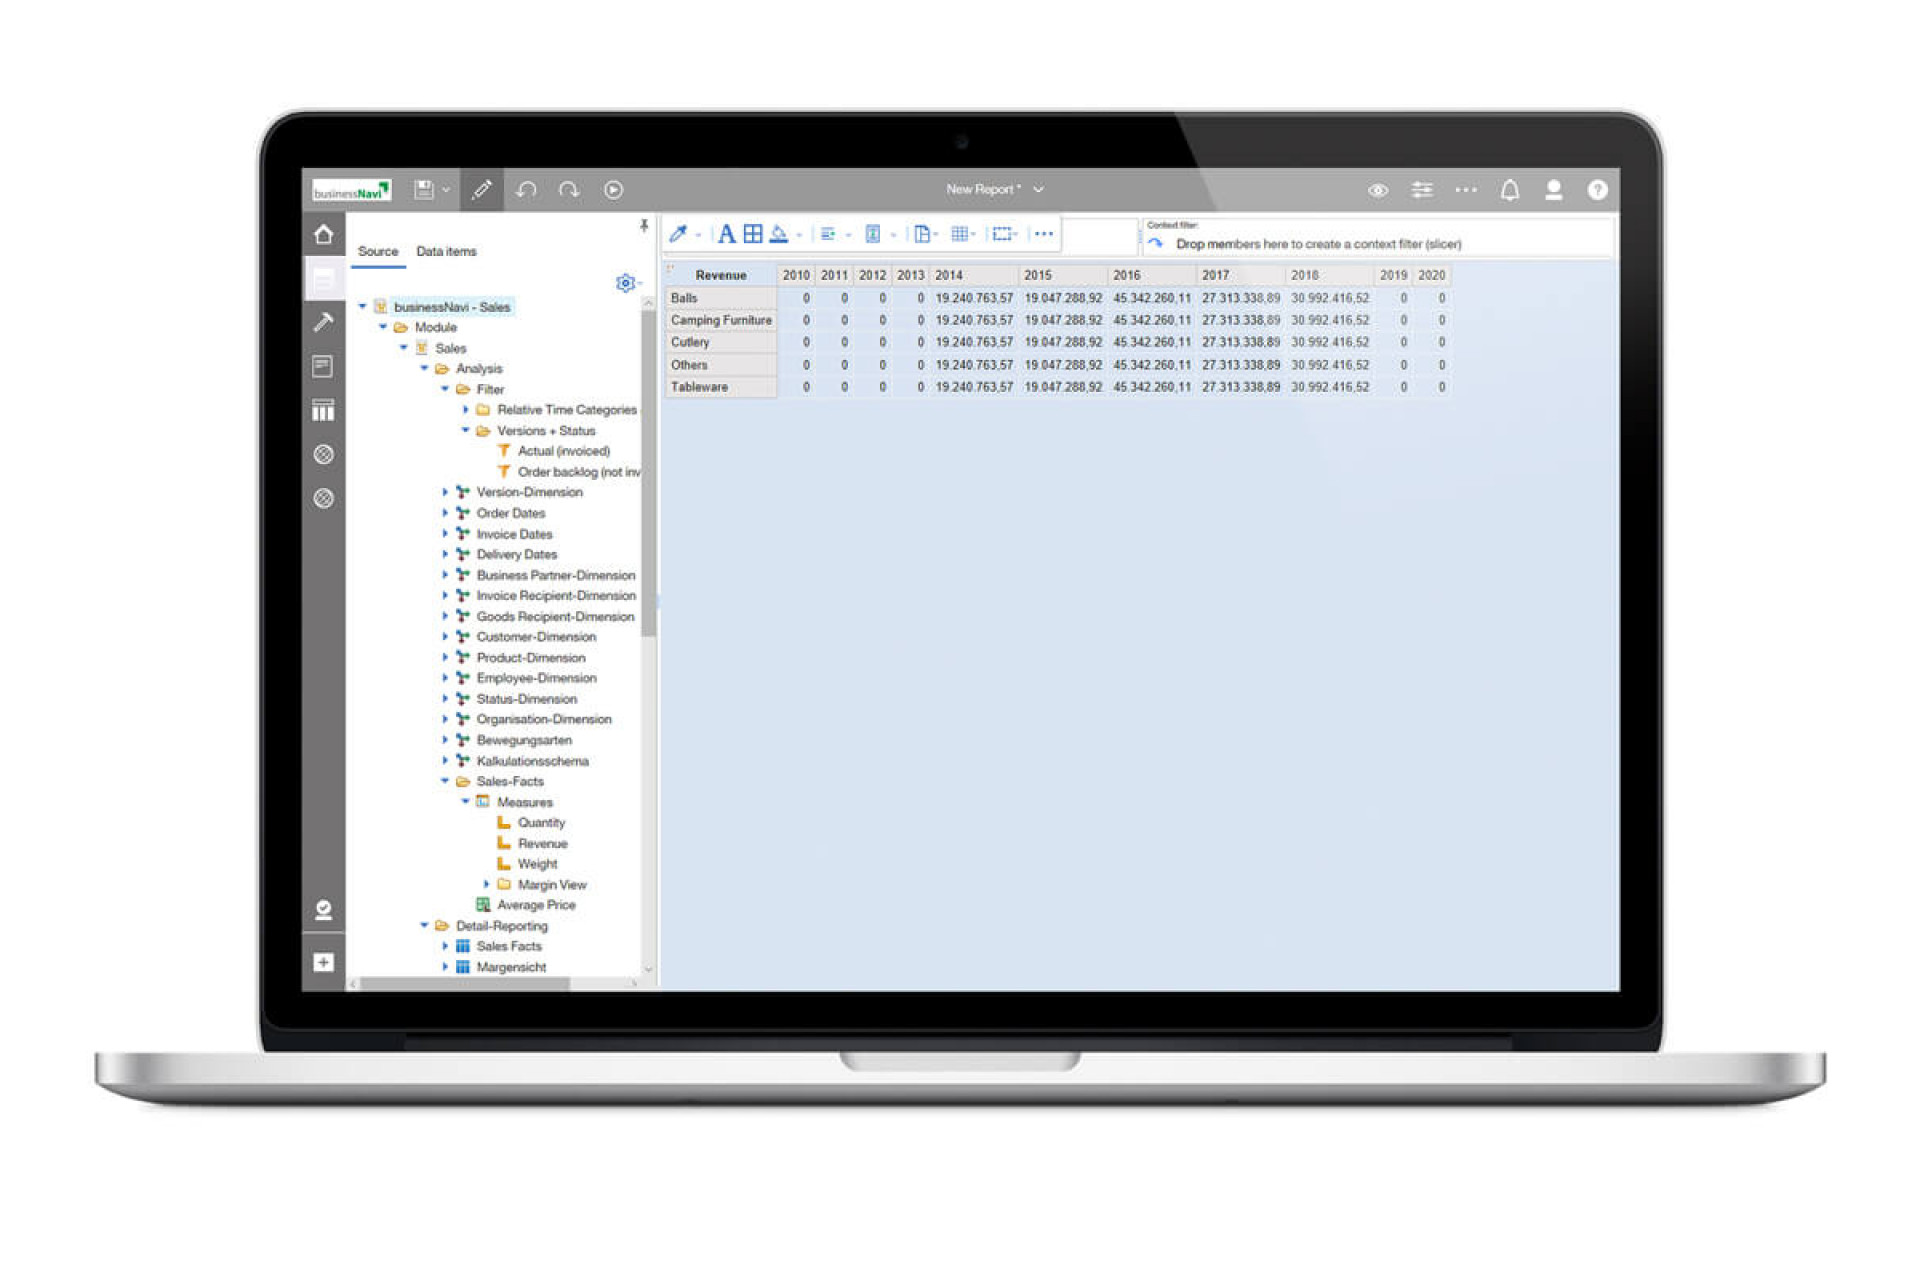
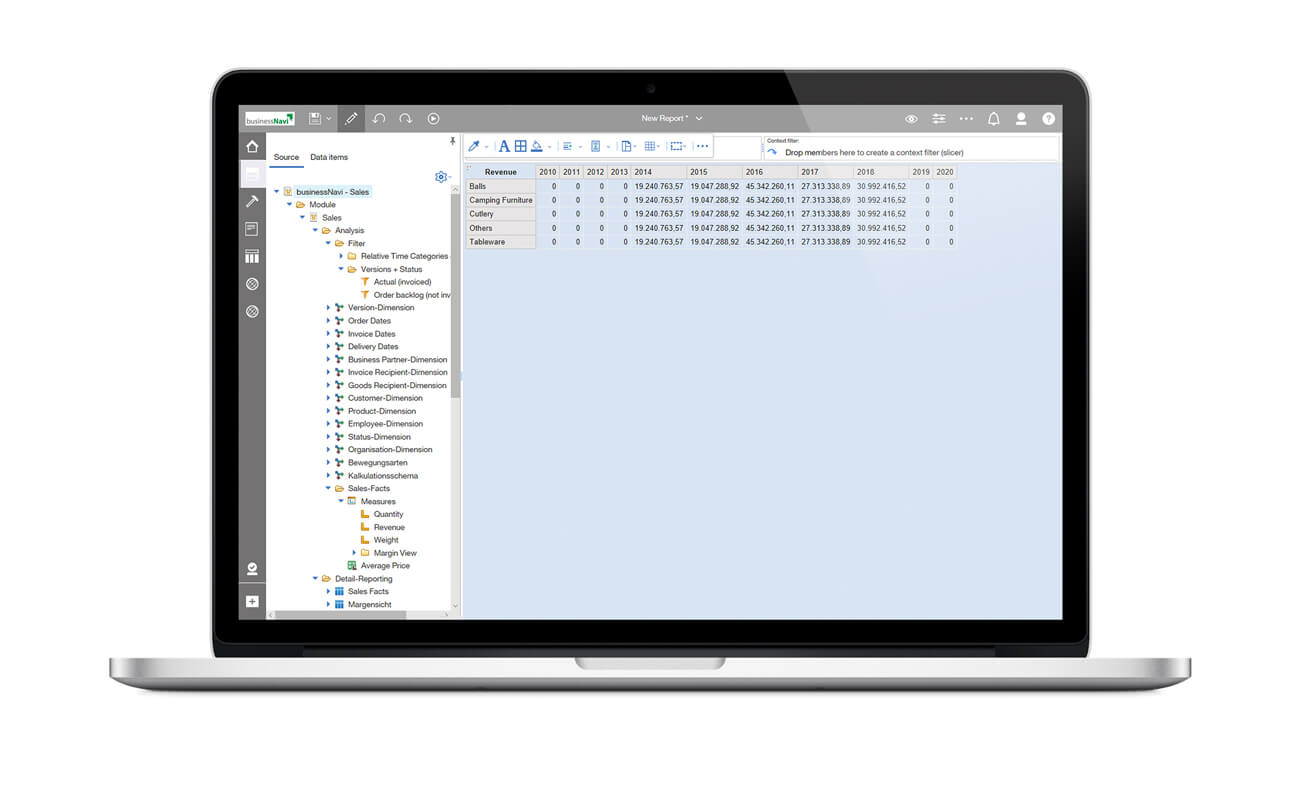
Analyzing means: You create matrixes, diagrams and lists with different key figures or your own calculations and evaluate them according to different evaluation dimensions.
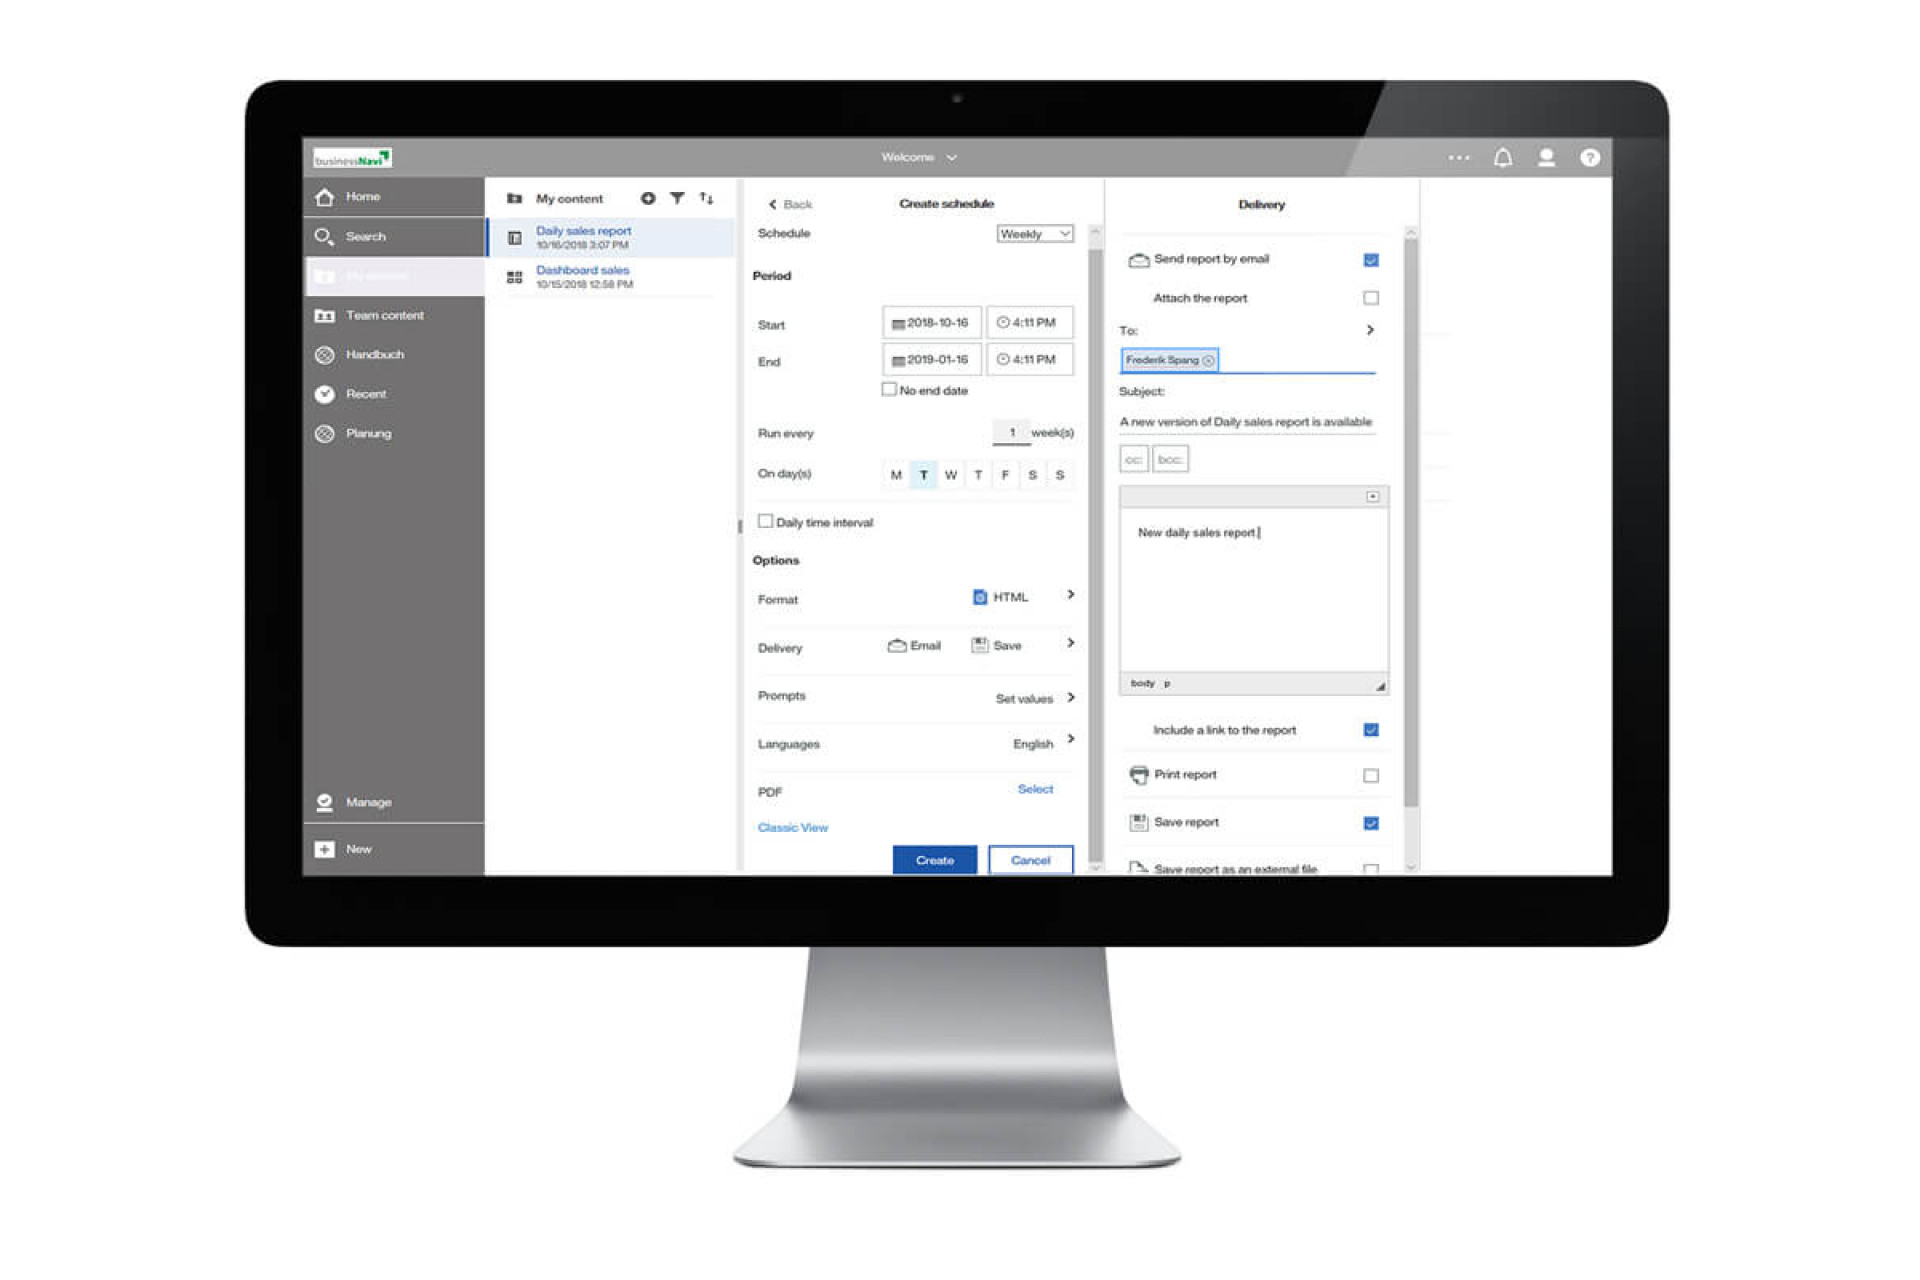
The results of your analyses can be saved as a report and thus made available to a wide range of recipients.
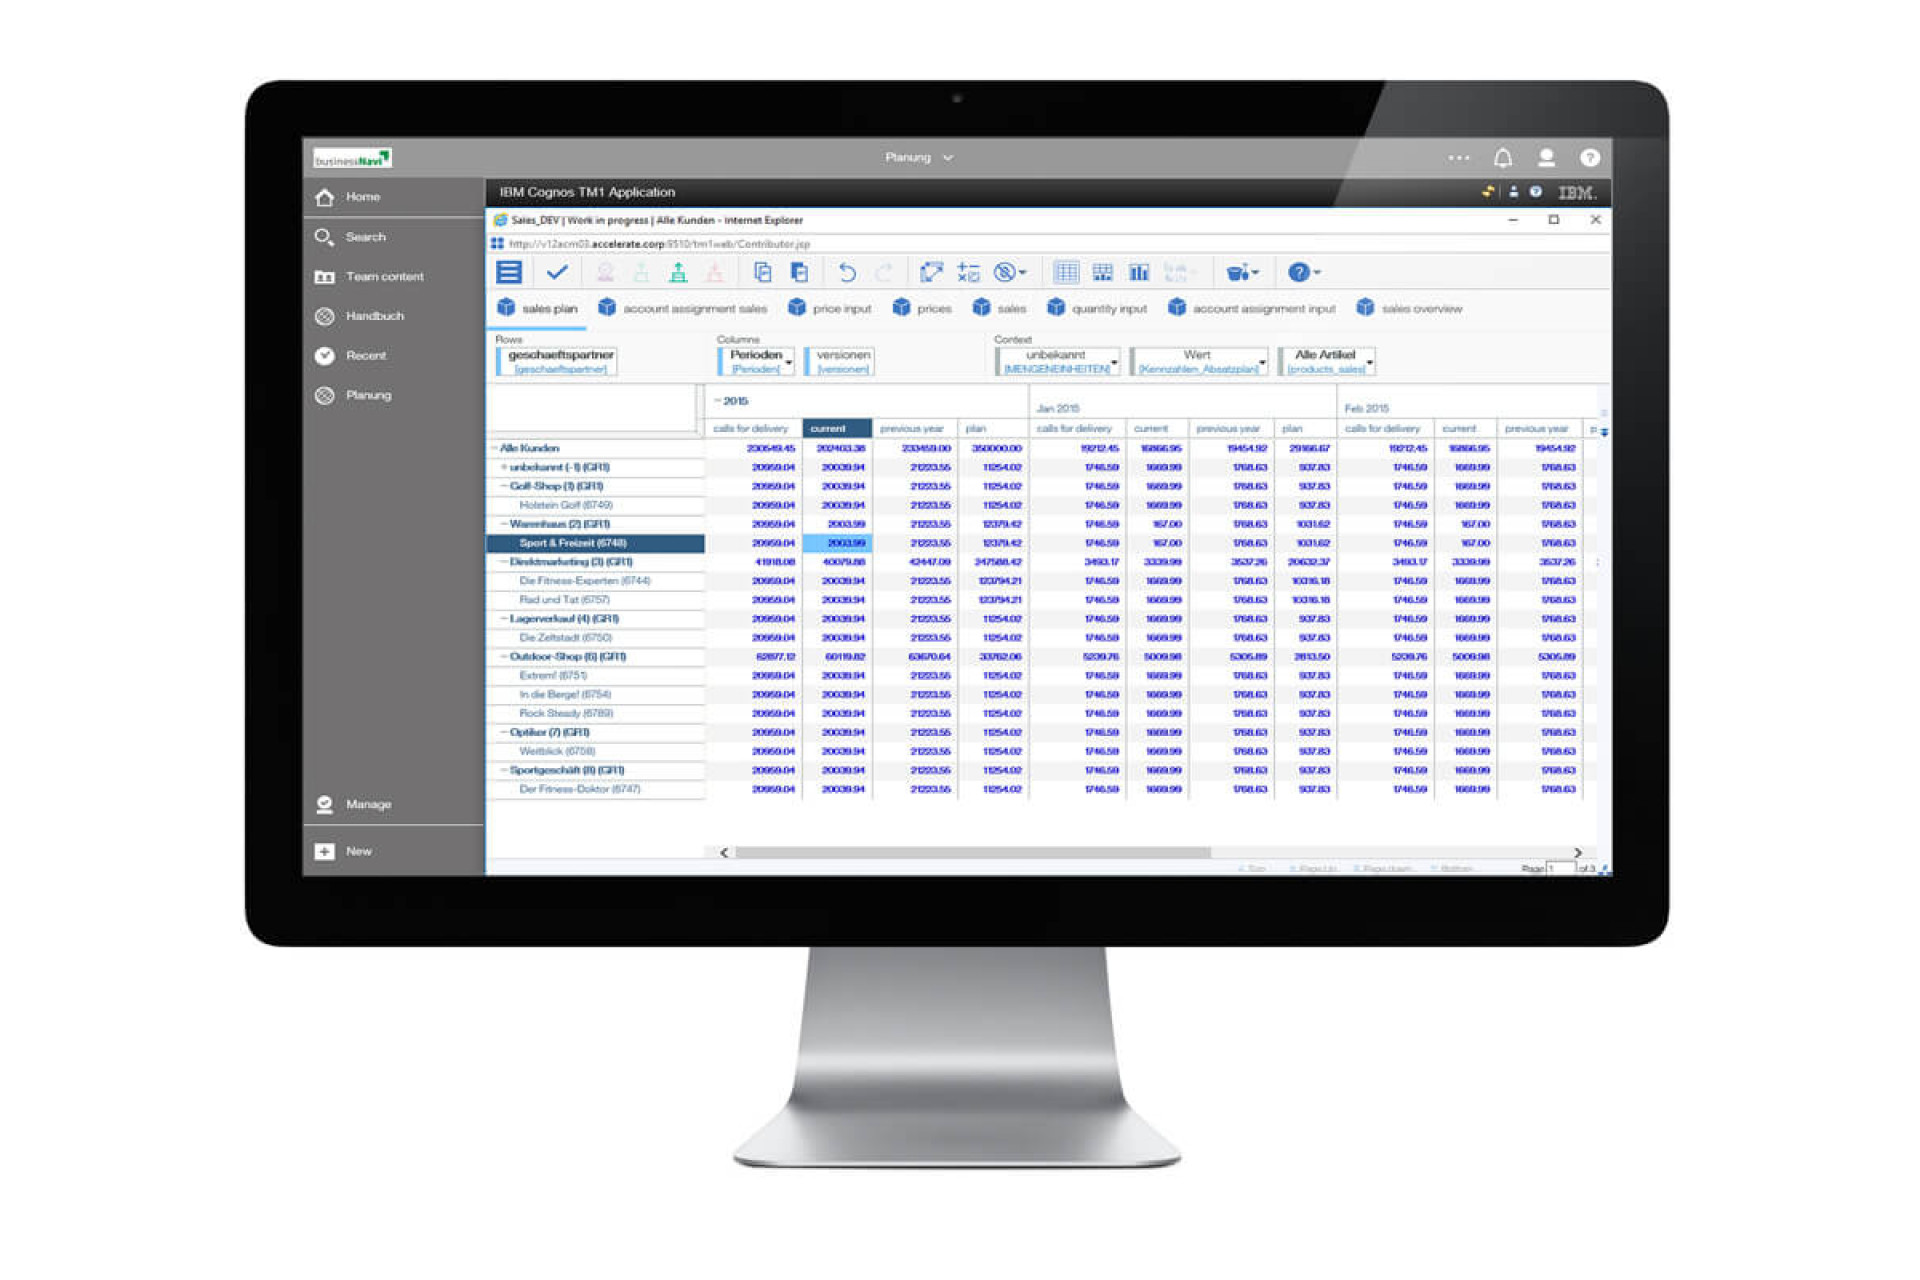
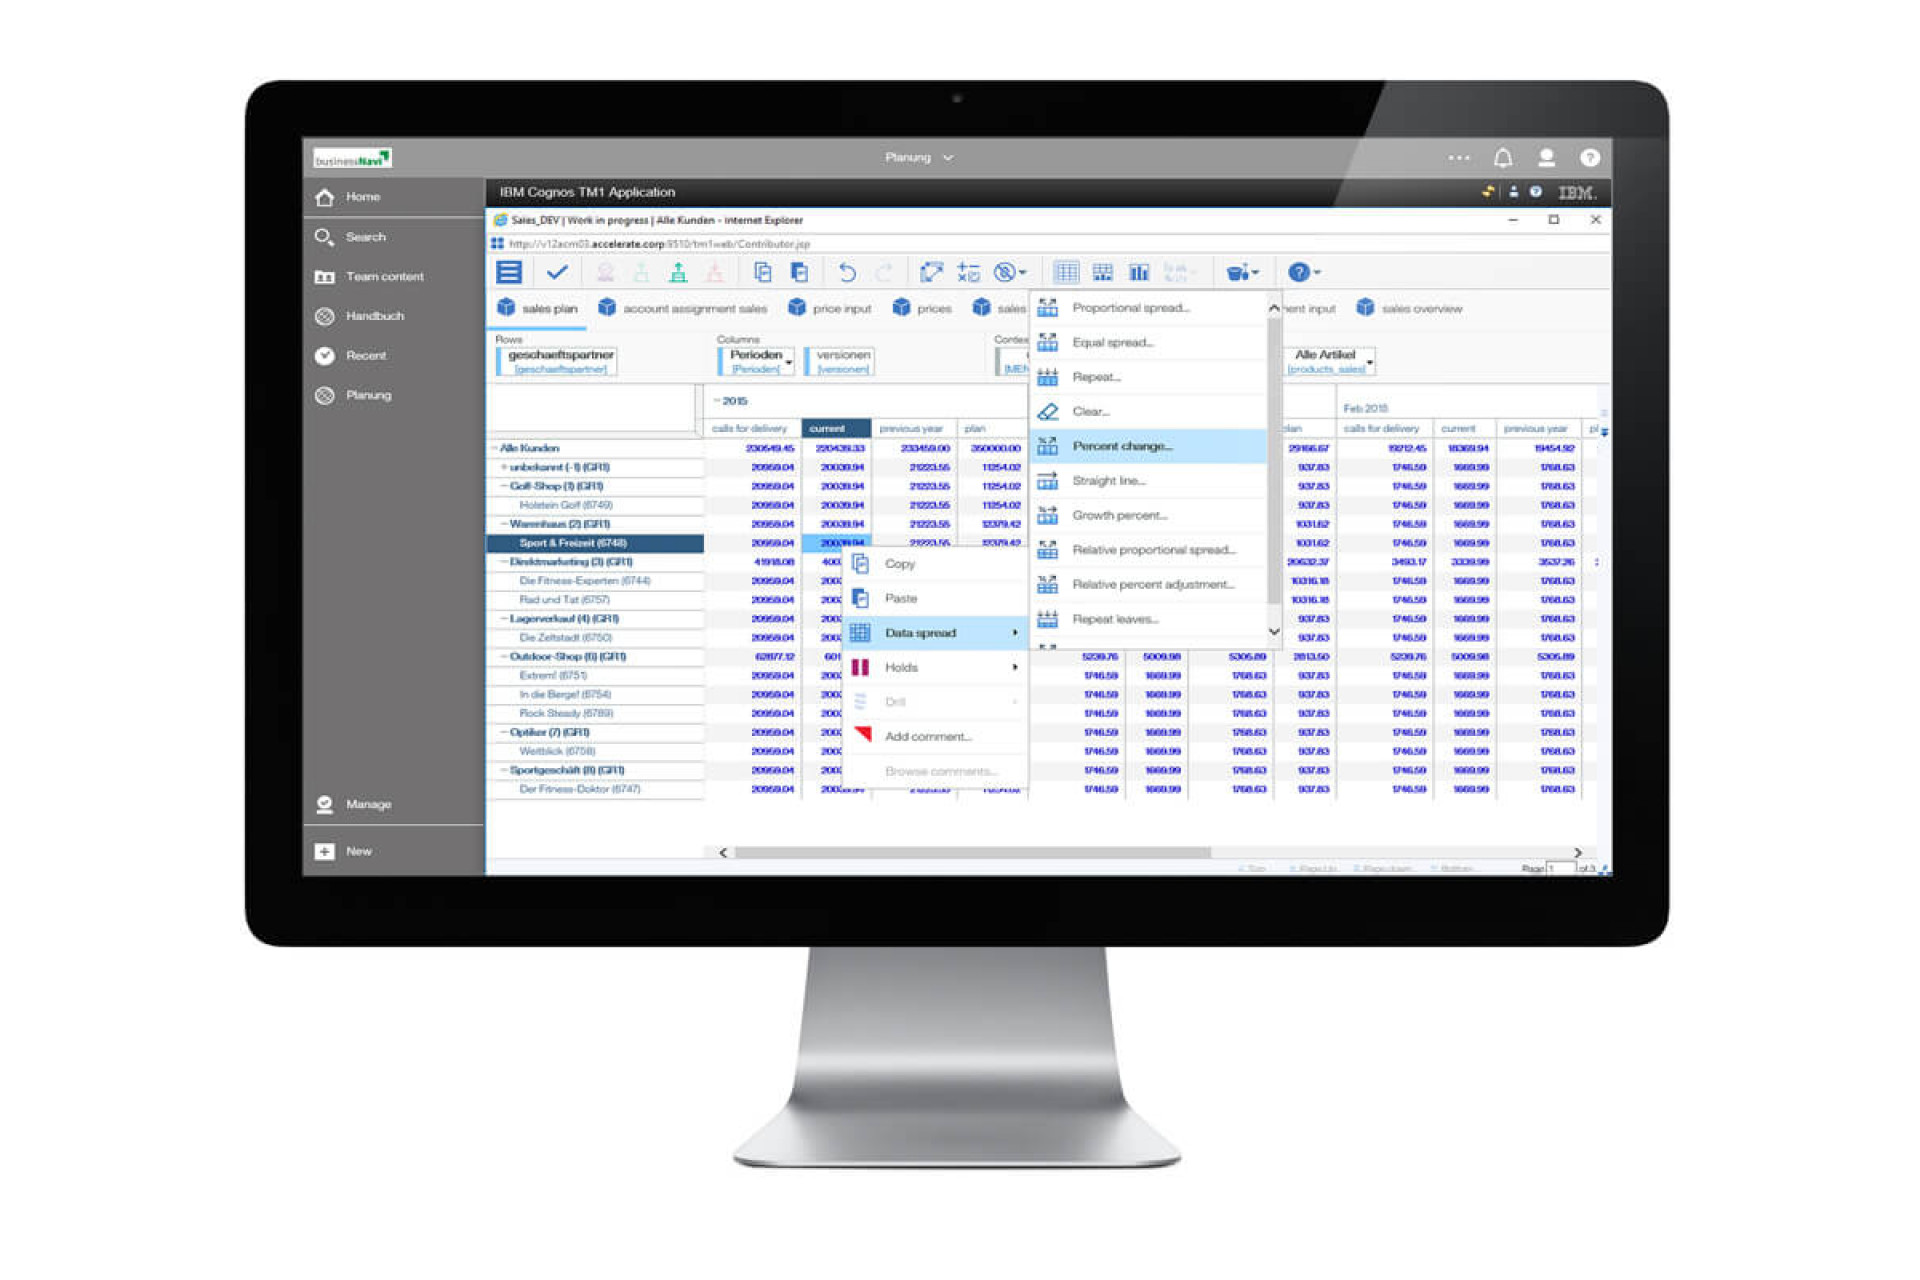
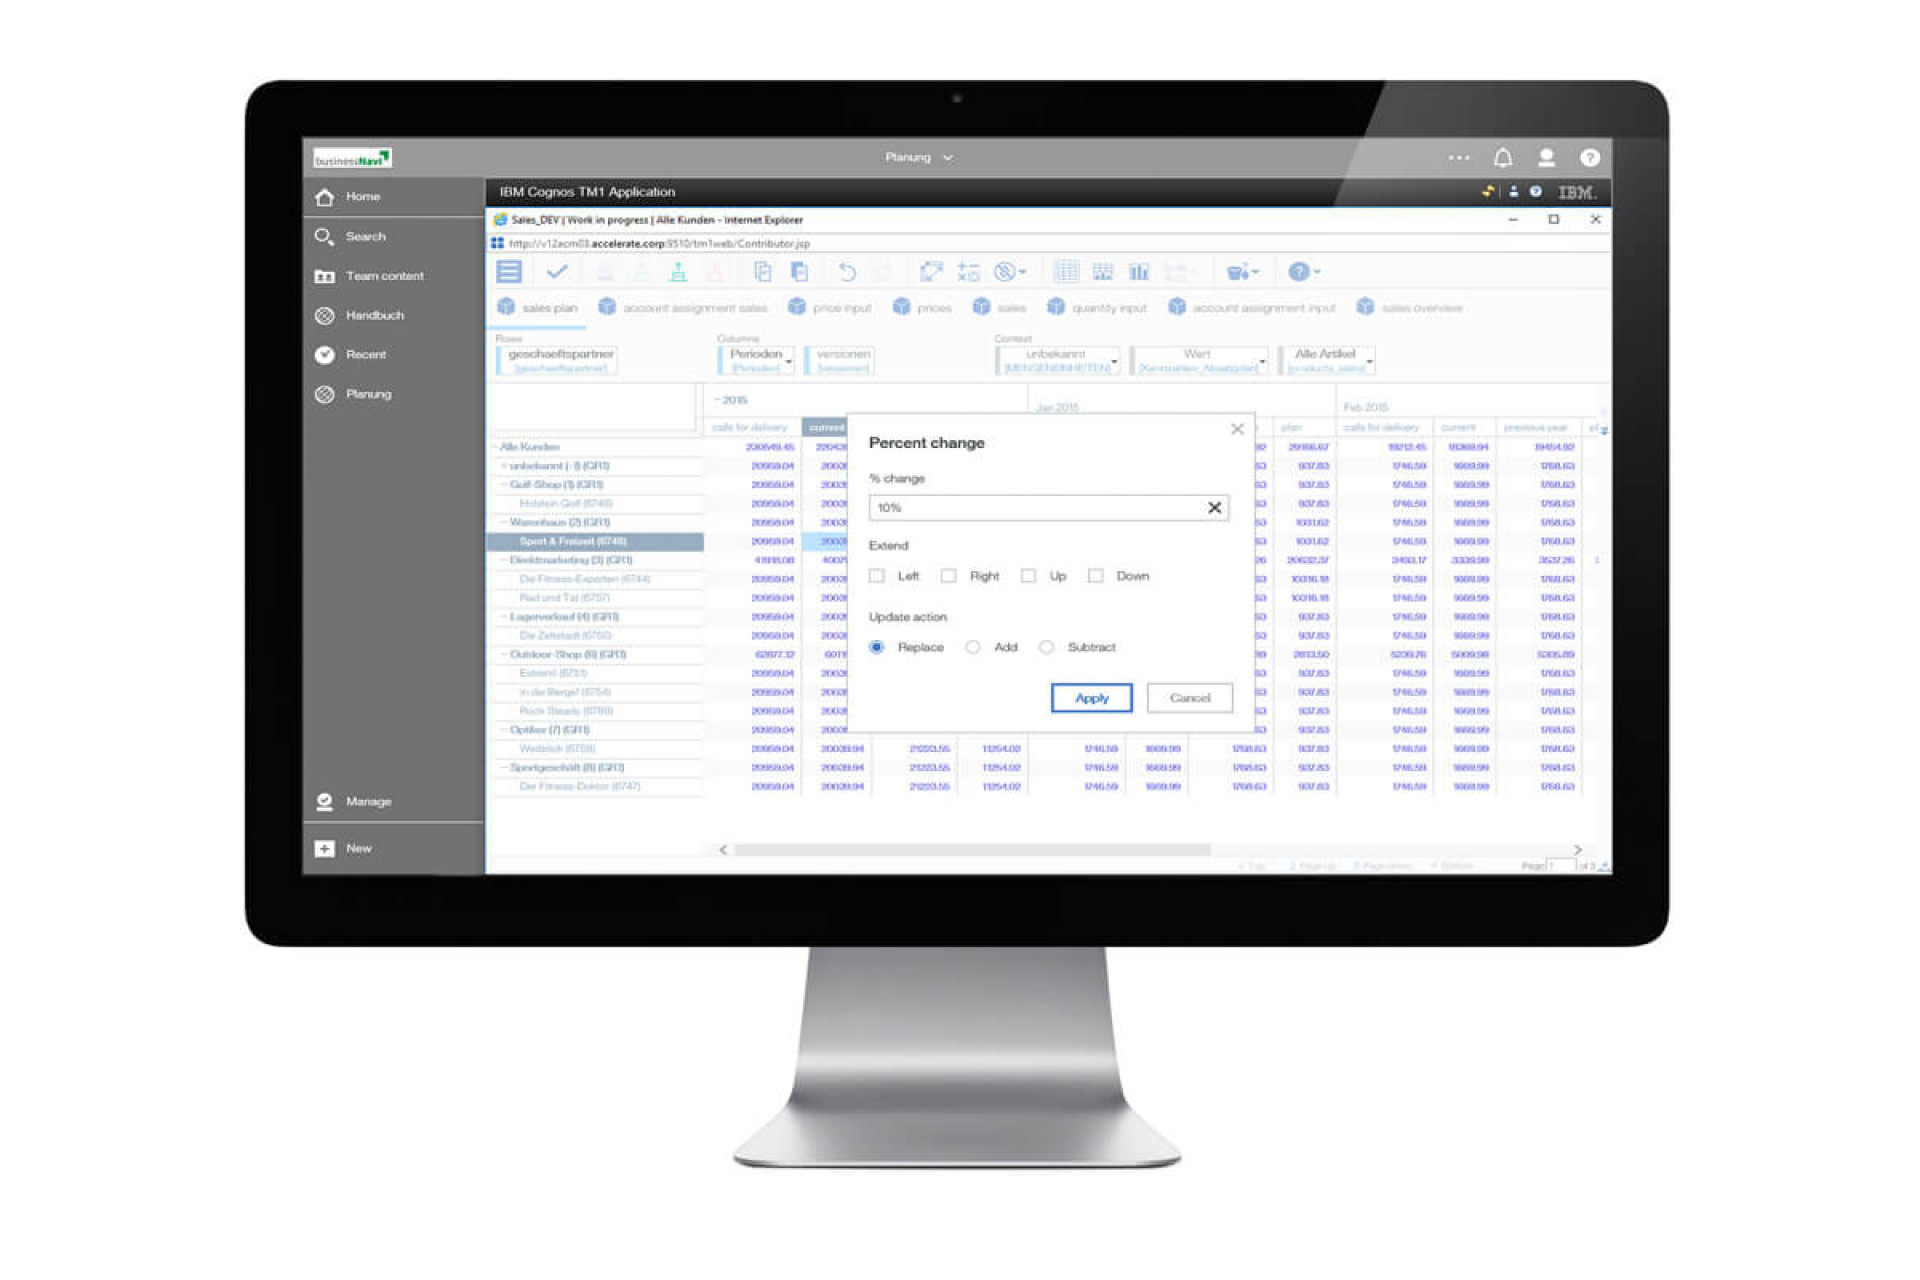
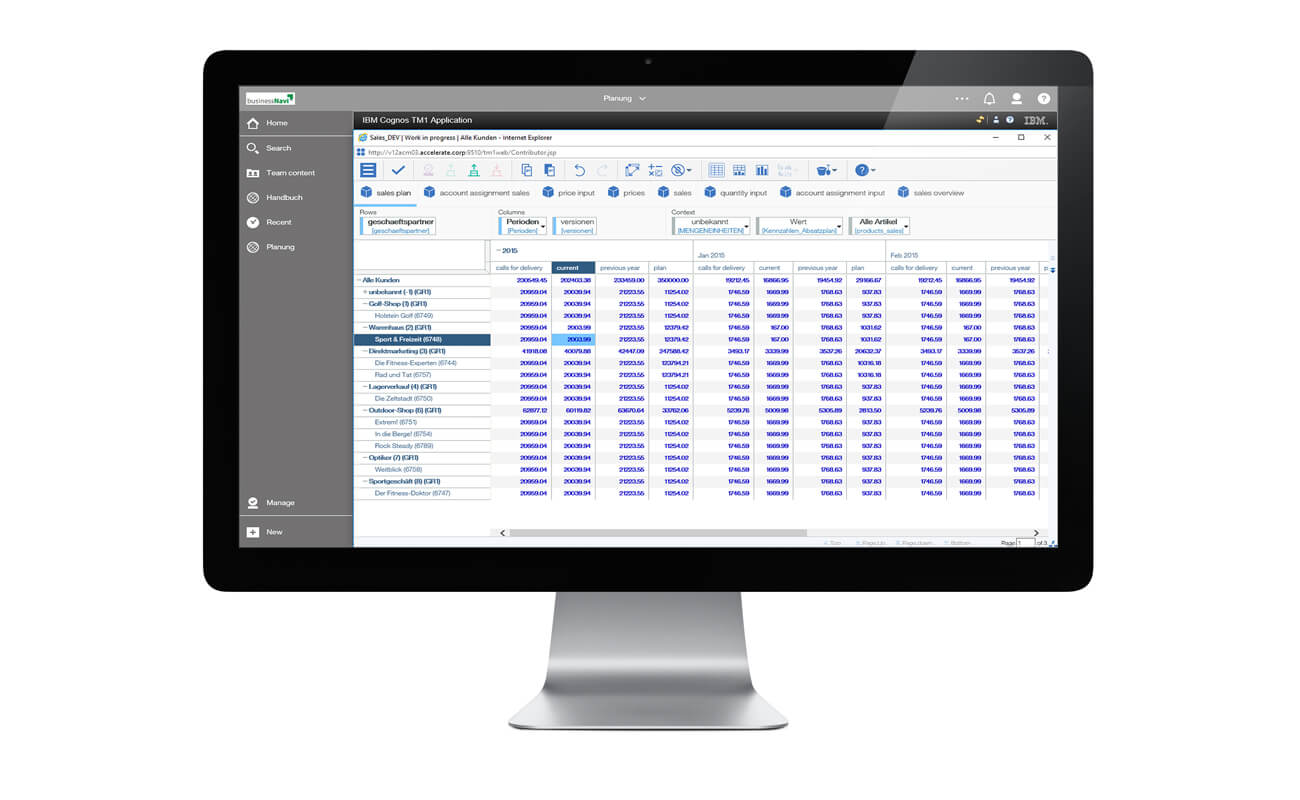
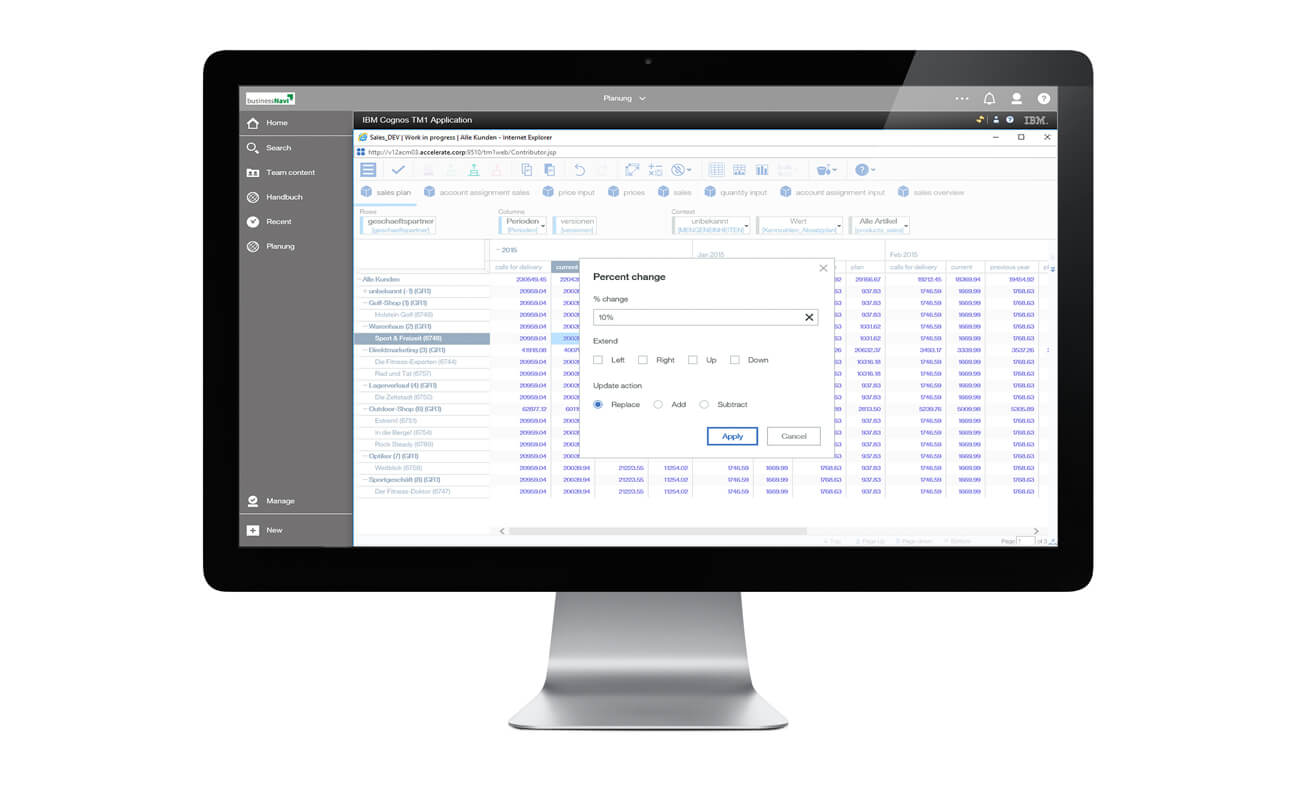
Simple planning …
The businessNavi integrates IBM Cognos TM1 as state-of-the-art planning software.
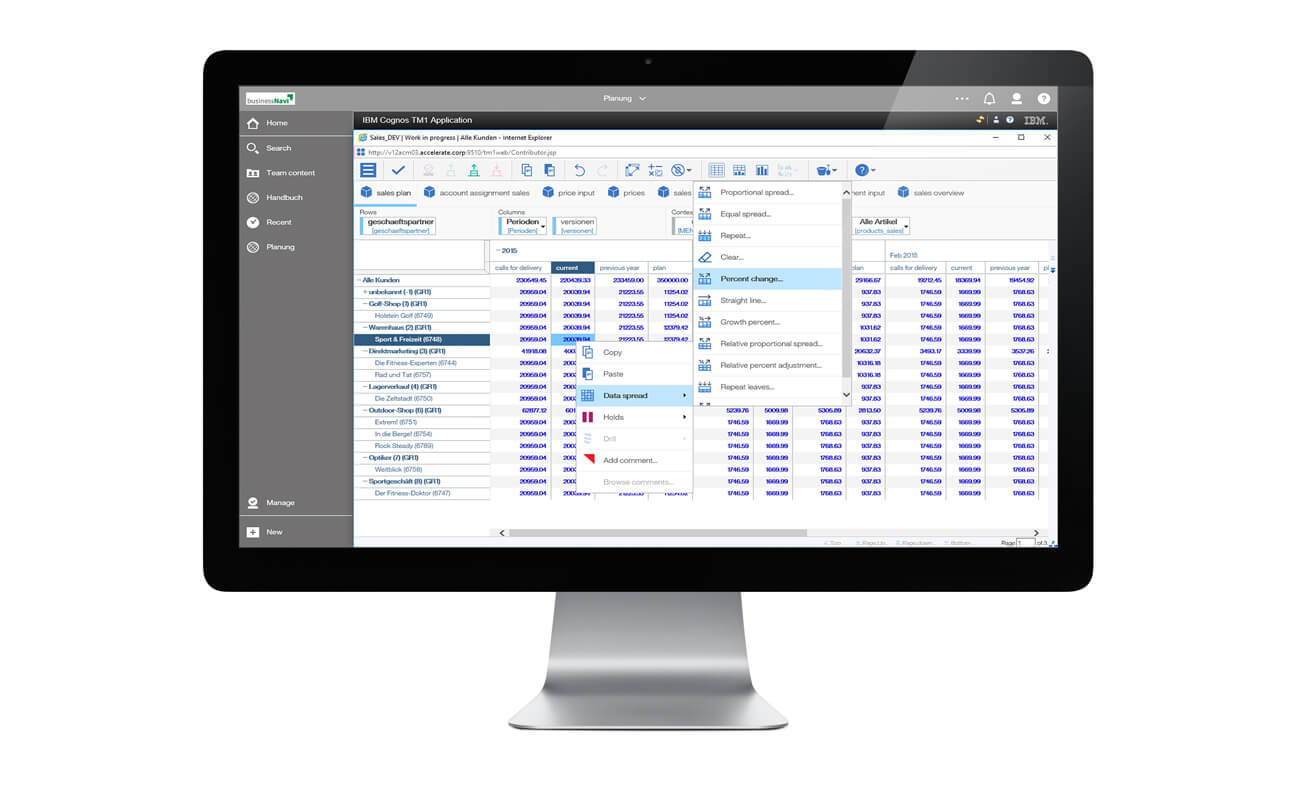
Distribute the planning tasks in the team – a workflow controls the distributed data input and creates transparency about the progress of individual subplans. Thus, work simultaneously on the data input and accelerate the planning process. The data structures and data from the businessNavi are automatically transferred to the planning application on a daily basis. Use various distribution functions for top-down planning and quick adjustments.
Compare different scenarios. The current status of planning is immediately available in reports and evaluations. Save time and effort consolidating and updating Excel files.
businessNavi – State of the Art Components
basic / professional

Reporting- & Analytics Framework

Planning Functionality

Data Base & Data Warehouse (Data Vault)
High-End ETL Tool
BusinessNavi ® integrates IBM products from the area of data analytics and a predefined data model into an integrated comprehensive solution for all matters in different functional areas. BusinessNavi is available in two different versions: basic and professional. You choose the scope that fits ideally into your data and IT strategy.
businessNavi – basic:
- Analysis and planning based on existing corporate data
- Use of state-of-the-art IBM software products to modernize applications in the areas of reporting, analysis and planning
businessNavi – professional:
- Establishment of an integrated database (data warehouse) and implementation of an automated data management system
- Introduction of analysis and planning tools, suitable to the provided data model
- Flexibly expandable so that all analytical questions can be answered

Data evaluation
- Integrated platform for reporting, analysis & dashboards
- Intuitive tools for working with data – basis for real self-service
- Integrated AI for forecasts/projections and for identifying insights from data

Data input
- Mapping of individual planning processes, flexibly expandable with automatic data supply
- Assistance with data entry (distribution functions, forecast algorithms, etc.) to accelerate planning processes

Data management
- Central data storage for all relevant company data
- Flexible data model (Data Vault) with precise rules and interfaces for expansion
- High performance even for complex queries on mass data
Data supply
- Professional tool for connecting different data sources
- Templates for efficient connection of additional systems and data sources
- Web-based programming with AI support
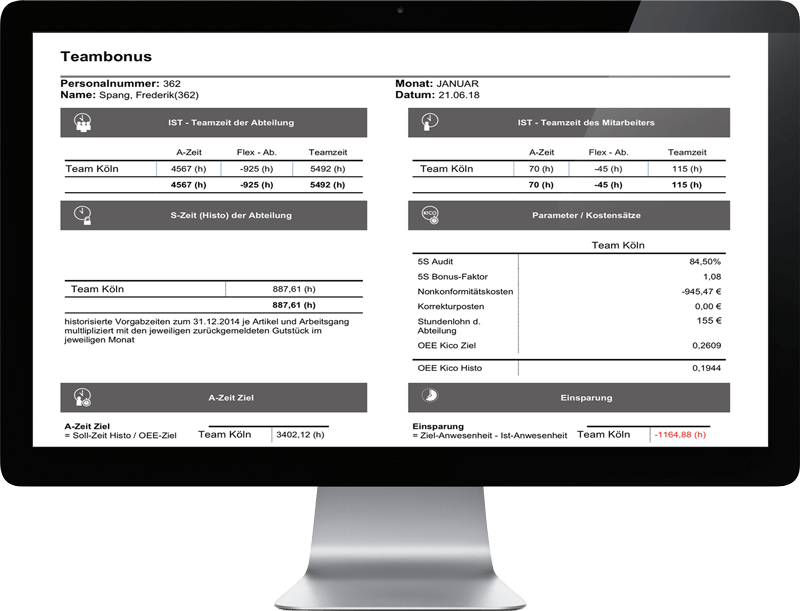
Project examples
Solution: Calculation of an employee-OEE as a ratio of target time of the production (the base output volume times expected time) and the presence of all employees within the department. Determination of the saved time compared to the efficiency goal. Evaluation of the savings will be conducted with an average wage considering further factors. Afterwards, pro-rata distribution of the savings and expression of the calculation for the payroll accounting.
Solution: Based on a control table, all cost-centers of the cost accounting will be matched with the equivalent results areas. Nominal accounts of the financial accounting such as turnover and material which can be matched immediately, will be allocated towards their parts list via article allocations. Indirect nominal accounts such as discounts and bonuses will be allocated accordingly based on the turnover per customer and article. A total transition of the financial- and cost-center accounting’s entries for illustration of the division calculation overview is controlling the relevance of the remaining positions.
Solution: The delivery calls are kept history of, so that all demand levels are recognized and utilized as a basis for statistic evaluations. In order to identify conspicuous customer/article combinations, the previous day is used for comparison and a transformation is determined. Moreover, a comparison with the LAB-status is conducted. A weighing of both factors induces a list filter. The report will be checked and edited daily in correspondence with sales, purchases, and production.
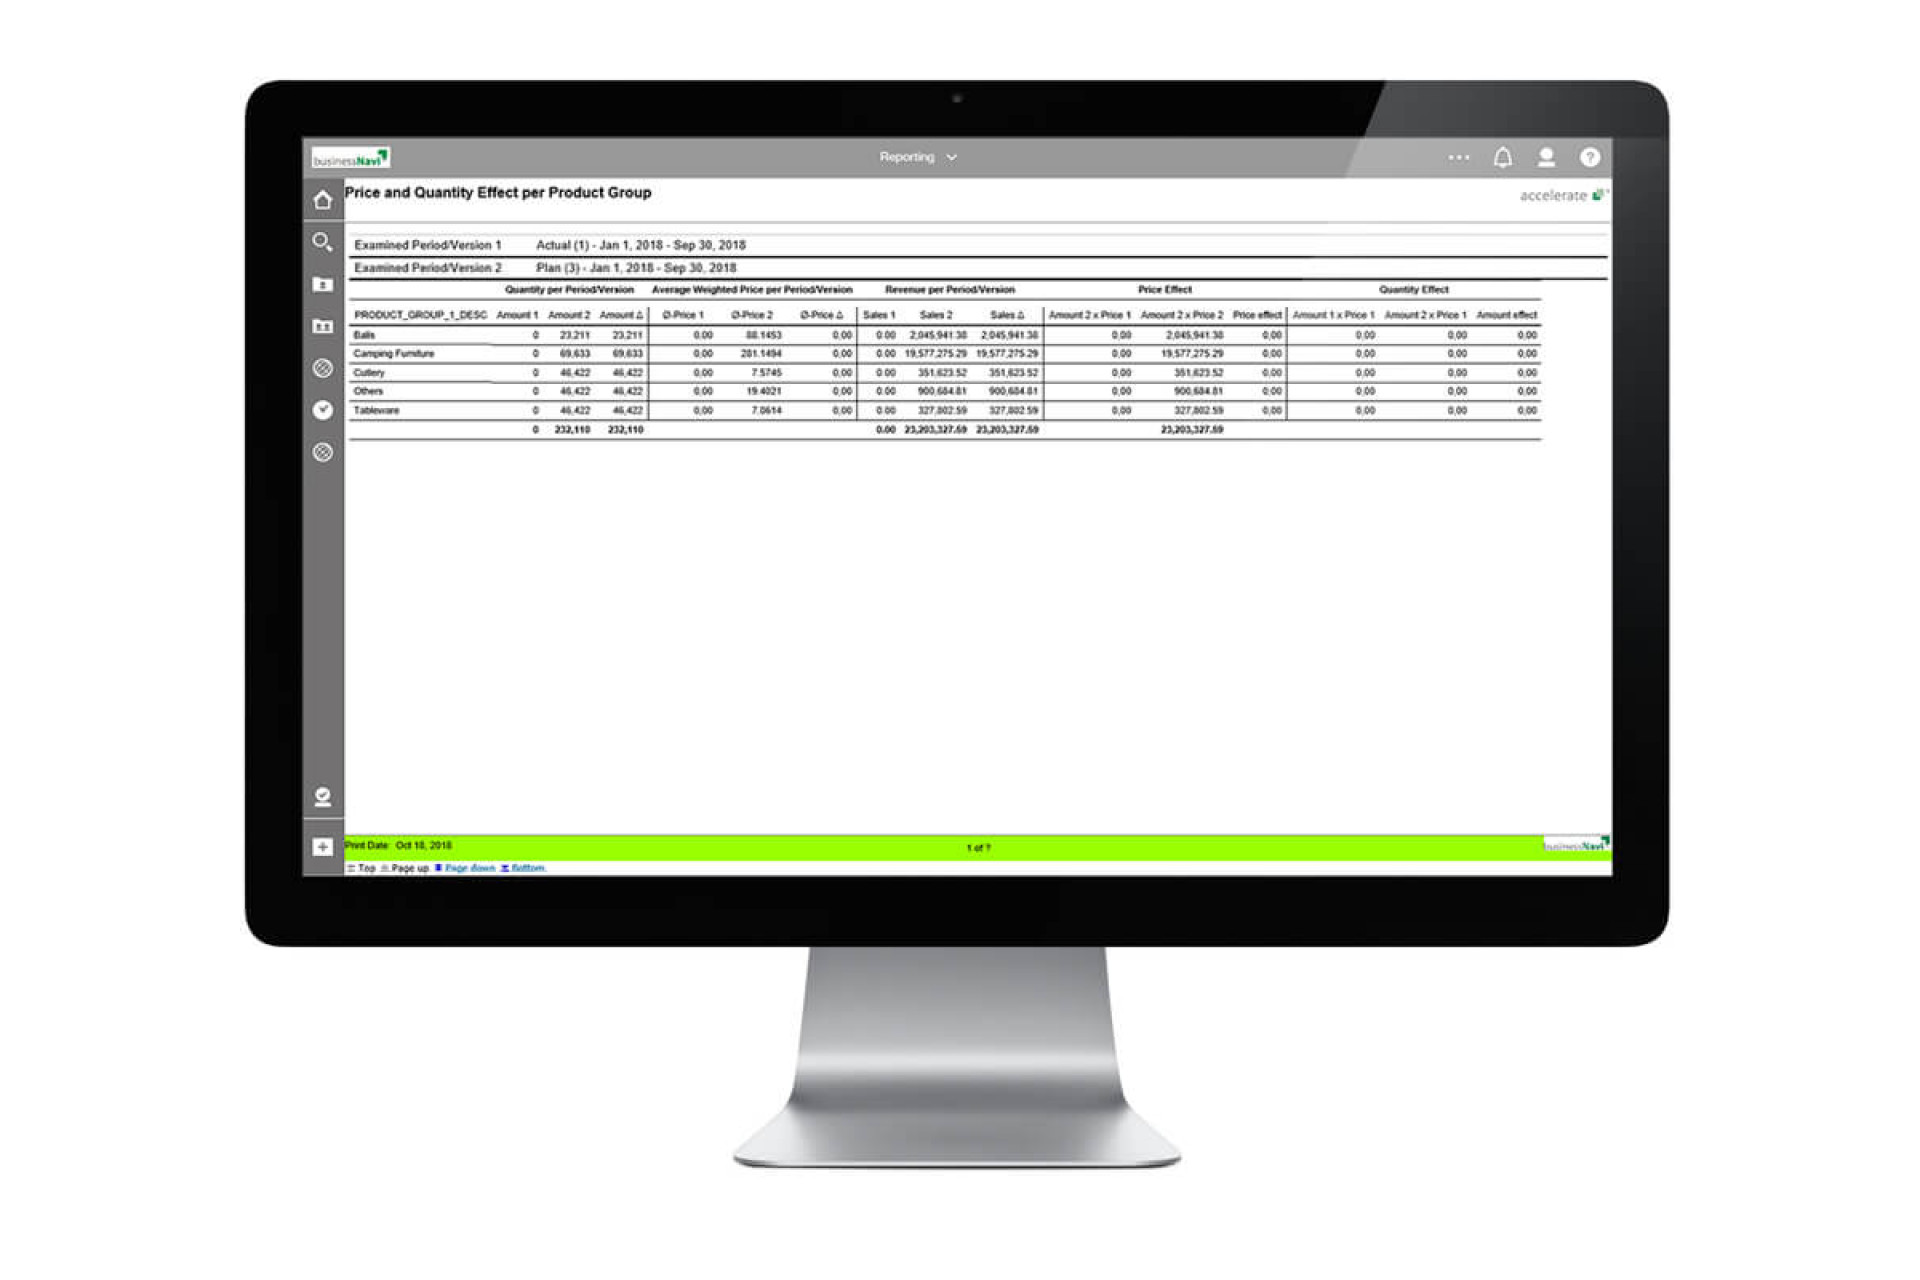
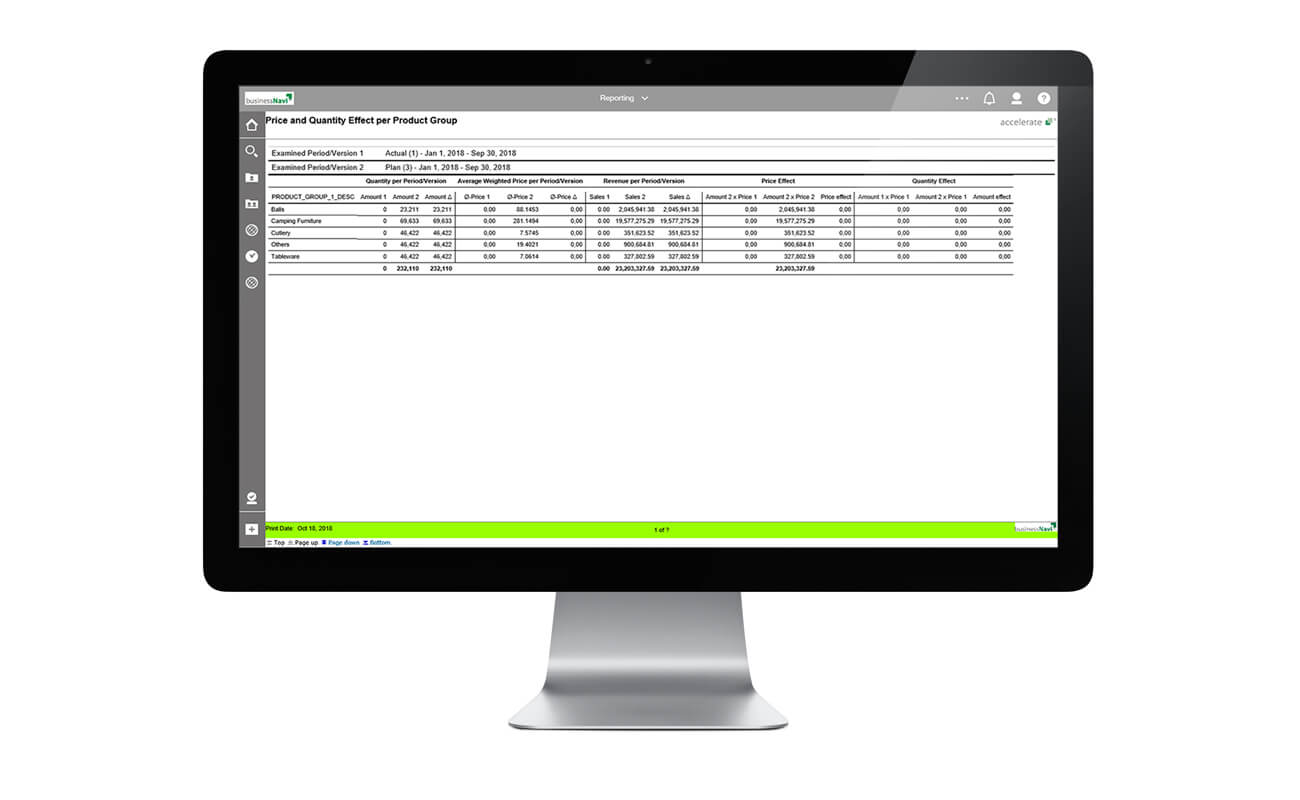
Solution: Evaluation of different quality structures with variable price versions. Different deviations can be displayed and assessed between product group level and individual level.
Solution: Furthermore, a referral to the article for sale occurs in order to reveal the impact of the changes in material price on the margin.
“Available anywhere and anytime.”
Accelerate – all around consulting service
The management team brought its many years of experience gained in corporate groups and medium-sized companies in the specialist areas of finance/controlling and marketing/sales to the founding of Accelerate in 1999. Our wealth of experience is based on the fact that we have predominantly played a decisive role in the development and restructuring phases of companies.
The name of the company was chosen deliberately: achieving measurable results quickly was and is our concern. Every vision, every strategy thrives on successes achieved step by step. In our projects we thus create benefits for our customers.
Customer, value and realization orientation are the benchmarks of our work.
Over the years, information technology has become increasingly important for the realization of concepts for the controlling of companies. This led to the foundation of Accelerate IT Consulting in Berlin in 2005. Here the IT-technical competences in the realization and support of applications are bundled. The technological development towards web-based solutions finally led to the addition of a further service offering: Hosting of company software and BI solutions.
Partner
Contact persons


